Immigrants from Romania vs Immigrants from Poland Single Male Poverty
COMPARE
Immigrants from Romania
Immigrants from Poland
Single Male Poverty
Single Male Poverty Comparison
Immigrants from Romania
Immigrants from Poland
11.7%
SINGLE MALE POVERTY
99.8/ 100
METRIC RATING
57th/ 347
METRIC RANK
11.5%
SINGLE MALE POVERTY
99.9/ 100
METRIC RATING
45th/ 347
METRIC RANK
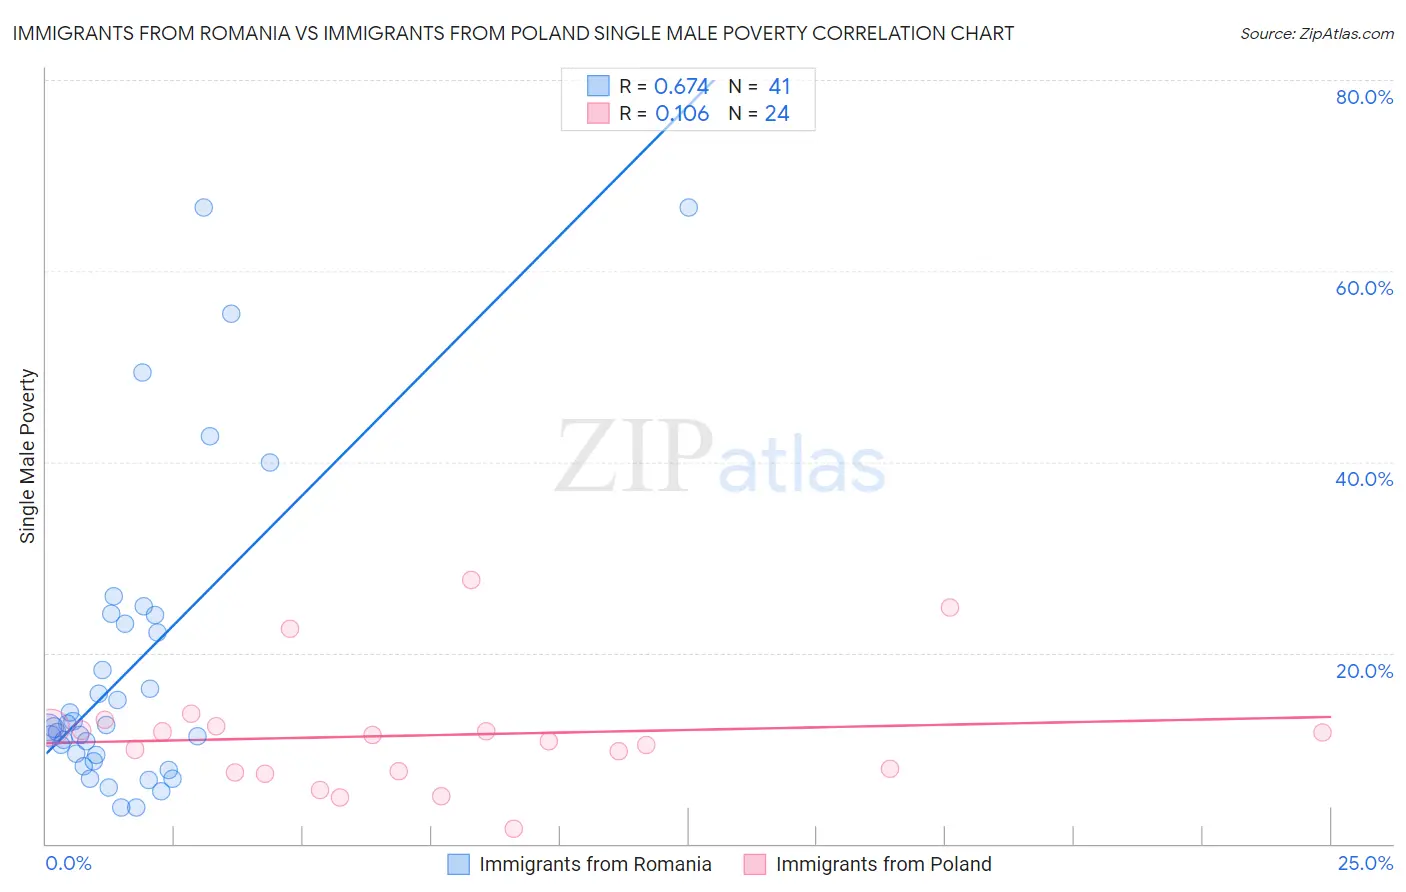
Immigrants from Romania vs Immigrants from Poland Single Male Poverty Correlation Chart
The statistical analysis conducted on geographies consisting of 233,050,167 people shows a significant positive correlation between the proportion of Immigrants from Romania and poverty level among single males in the United States with a correlation coefficient (R) of 0.674 and weighted average of 11.7%. Similarly, the statistical analysis conducted on geographies consisting of 269,525,262 people shows a poor positive correlation between the proportion of Immigrants from Poland and poverty level among single males in the United States with a correlation coefficient (R) of 0.106 and weighted average of 11.5%, a difference of 1.7%.
Single Male Poverty Correlation Summary
| Measurement | Immigrants from Romania | Immigrants from Poland |
| Minimum | 3.8% | 1.6% |
| Maximum | 66.7% | 27.7% |
| Range | 62.9% | 26.1% |
| Mean | 18.7% | 11.4% |
| Median | 12.2% | 11.1% |
| Interquartile 25% (IQ1) | 9.0% | 7.6% |
| Interquartile 75% (IQ3) | 23.5% | 12.2% |
| Interquartile Range (IQR) | 14.5% | 4.7% |
| Standard Deviation (Sample) | 16.2% | 6.1% |
| Standard Deviation (Population) | 16.0% | 6.0% |
Demographics Similar to Immigrants from Romania and Immigrants from Poland by Single Male Poverty
In terms of single male poverty, the demographic groups most similar to Immigrants from Romania are Immigrants from Brazil (11.7%, a difference of 0.020%), Brazilian (11.8%, a difference of 0.11%), Burmese (11.7%, a difference of 0.15%), Peruvian (11.8%, a difference of 0.32%), and Cambodian (11.8%, a difference of 0.34%). Similarly, the demographic groups most similar to Immigrants from Poland are Immigrants from Cameroon (11.5%, a difference of 0.020%), Immigrants from Peru (11.5%, a difference of 0.030%), Immigrants from Bulgaria (11.6%, a difference of 0.13%), Egyptian (11.5%, a difference of 0.18%), and Immigrants from Iraq (11.5%, a difference of 0.23%).
| Demographics | Rating | Rank | Single Male Poverty |
| Immigrants | Iraq | 99.9 /100 | #41 | Exceptional 11.5% |
| Egyptians | 99.9 /100 | #42 | Exceptional 11.5% |
| Immigrants | Peru | 99.9 /100 | #43 | Exceptional 11.5% |
| Immigrants | Cameroon | 99.9 /100 | #44 | Exceptional 11.5% |
| Immigrants | Poland | 99.9 /100 | #45 | Exceptional 11.5% |
| Immigrants | Bulgaria | 99.9 /100 | #46 | Exceptional 11.6% |
| Nepalese | 99.9 /100 | #47 | Exceptional 11.6% |
| Immigrants | Indonesia | 99.9 /100 | #48 | Exceptional 11.6% |
| Tlingit-Haida | 99.9 /100 | #49 | Exceptional 11.6% |
| Immigrants | Lithuania | 99.9 /100 | #50 | Exceptional 11.6% |
| Paraguayans | 99.9 /100 | #51 | Exceptional 11.6% |
| Samoans | 99.9 /100 | #52 | Exceptional 11.7% |
| Bulgarians | 99.9 /100 | #53 | Exceptional 11.7% |
| Immigrants | Uzbekistan | 99.9 /100 | #54 | Exceptional 11.7% |
| Cypriots | 99.9 /100 | #55 | Exceptional 11.7% |
| Burmese | 99.8 /100 | #56 | Exceptional 11.7% |
| Immigrants | Romania | 99.8 /100 | #57 | Exceptional 11.7% |
| Immigrants | Brazil | 99.8 /100 | #58 | Exceptional 11.7% |
| Brazilians | 99.8 /100 | #59 | Exceptional 11.8% |
| Peruvians | 99.8 /100 | #60 | Exceptional 11.8% |
| Cambodians | 99.8 /100 | #61 | Exceptional 11.8% |