Immigrants from Philippines vs Spanish American Female Poverty Among 25-34 Year Olds
COMPARE
Immigrants from Philippines
Spanish American
Female Poverty Among 25-34 Year Olds
Female Poverty Among 25-34 Year Olds Comparison
Immigrants from Philippines
Spanish Americans
12.0%
FEMALE POVERTY AMONG 25-34 YEAR OLDS
99.5/ 100
METRIC RATING
55th/ 347
METRIC RANK
16.7%
FEMALE POVERTY AMONG 25-34 YEAR OLDS
0.0/ 100
METRIC RATING
299th/ 347
METRIC RANK
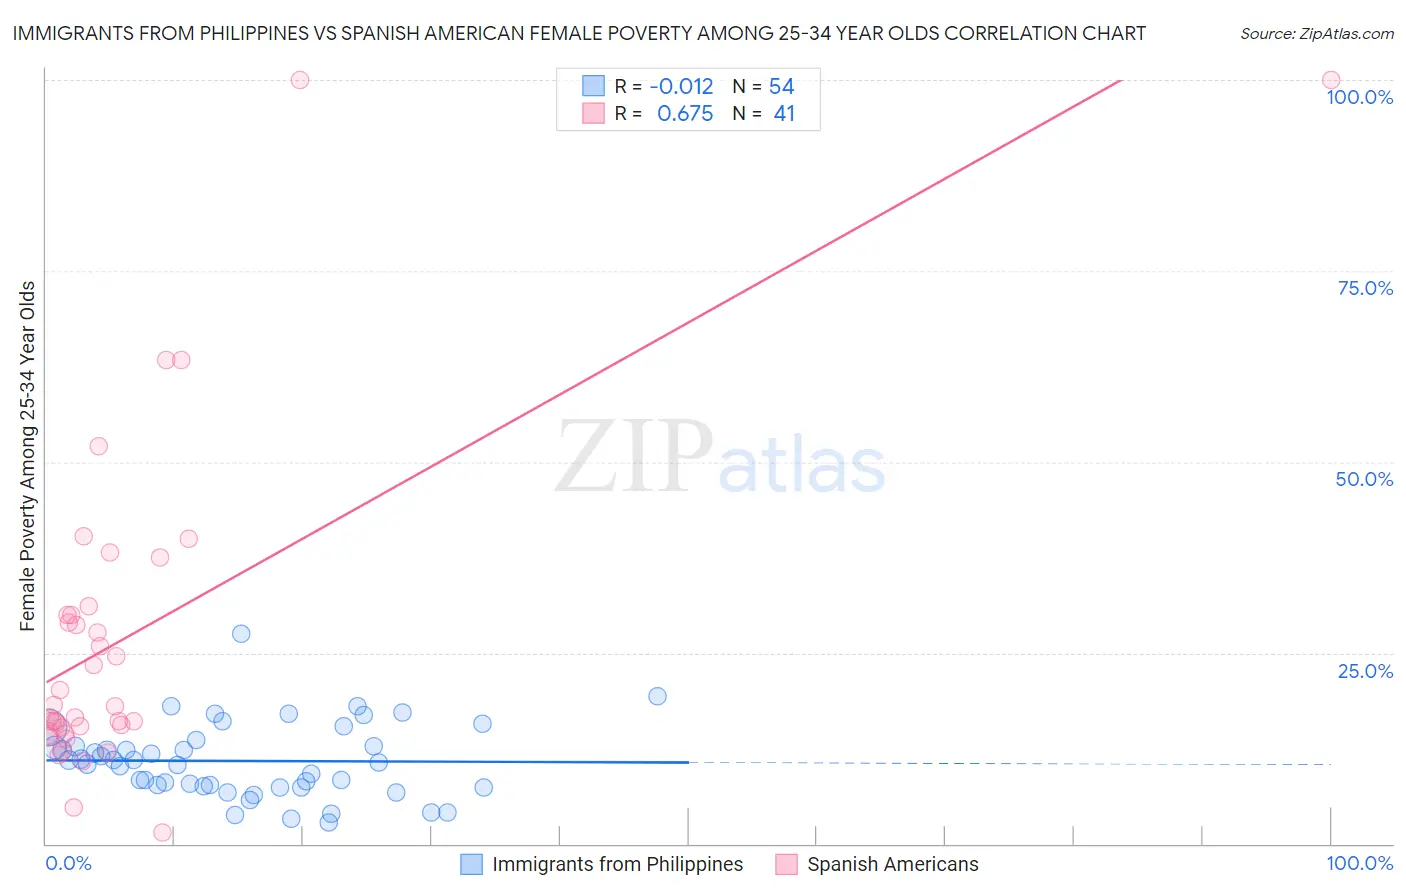
Immigrants from Philippines vs Spanish American Female Poverty Among 25-34 Year Olds Correlation Chart
The statistical analysis conducted on geographies consisting of 461,816,579 people shows no correlation between the proportion of Immigrants from Philippines and poverty level among females between the ages 25 and 34 in the United States with a correlation coefficient (R) of -0.012 and weighted average of 12.0%. Similarly, the statistical analysis conducted on geographies consisting of 102,935,839 people shows a significant positive correlation between the proportion of Spanish Americans and poverty level among females between the ages 25 and 34 in the United States with a correlation coefficient (R) of 0.675 and weighted average of 16.7%, a difference of 39.0%.
Female Poverty Among 25-34 Year Olds Correlation Summary
| Measurement | Immigrants from Philippines | Spanish American |
| Minimum | 2.9% | 1.6% |
| Maximum | 27.5% | 100.0% |
| Range | 24.7% | 98.4% |
| Mean | 10.8% | 27.1% |
| Median | 10.8% | 17.9% |
| Interquartile 25% (IQ1) | 7.5% | 14.9% |
| Interquartile 75% (IQ3) | 12.8% | 30.6% |
| Interquartile Range (IQR) | 5.3% | 15.7% |
| Standard Deviation (Sample) | 4.8% | 21.7% |
| Standard Deviation (Population) | 4.8% | 21.4% |
Similar Demographics by Female Poverty Among 25-34 Year Olds
Demographics Similar to Immigrants from Philippines by Female Poverty Among 25-34 Year Olds
In terms of female poverty among 25-34 year olds, the demographic groups most similar to Immigrants from Philippines are Eastern European (12.0%, a difference of 0.17%), Immigrants from Israel (12.0%, a difference of 0.29%), Luxembourger (12.1%, a difference of 0.33%), Jordanian (12.1%, a difference of 0.35%), and Immigrants from Eastern Europe (12.0%, a difference of 0.41%).
| Demographics | Rating | Rank | Female Poverty Among 25-34 Year Olds |
| Immigrants | Belarus | 99.6 /100 | #48 | Exceptional 12.0% |
| Immigrants | Egypt | 99.6 /100 | #49 | Exceptional 12.0% |
| Immigrants | Croatia | 99.6 /100 | #50 | Exceptional 12.0% |
| Paraguayans | 99.6 /100 | #51 | Exceptional 12.0% |
| Immigrants | Eastern Europe | 99.6 /100 | #52 | Exceptional 12.0% |
| Immigrants | Israel | 99.6 /100 | #53 | Exceptional 12.0% |
| Eastern Europeans | 99.6 /100 | #54 | Exceptional 12.0% |
| Immigrants | Philippines | 99.5 /100 | #55 | Exceptional 12.0% |
| Luxembourgers | 99.5 /100 | #56 | Exceptional 12.1% |
| Jordanians | 99.4 /100 | #57 | Exceptional 12.1% |
| Immigrants | Romania | 99.4 /100 | #58 | Exceptional 12.1% |
| Russians | 99.4 /100 | #59 | Exceptional 12.1% |
| Immigrants | Northern Europe | 99.4 /100 | #60 | Exceptional 12.1% |
| Immigrants | Czechoslovakia | 99.4 /100 | #61 | Exceptional 12.1% |
| Immigrants | Moldova | 99.3 /100 | #62 | Exceptional 12.1% |
Demographics Similar to Spanish Americans by Female Poverty Among 25-34 Year Olds
In terms of female poverty among 25-34 year olds, the demographic groups most similar to Spanish Americans are Blackfeet (16.7%, a difference of 0.040%), U.S. Virgin Islander (16.7%, a difference of 0.15%), Immigrants from Congo (16.7%, a difference of 0.16%), Alaska Native (16.8%, a difference of 0.27%), and Immigrants from Guatemala (16.6%, a difference of 0.55%).
| Demographics | Rating | Rank | Female Poverty Among 25-34 Year Olds |
| Immigrants | Dominica | 0.0 /100 | #292 | Tragic 16.5% |
| Potawatomi | 0.0 /100 | #293 | Tragic 16.5% |
| Immigrants | Central America | 0.0 /100 | #294 | Tragic 16.6% |
| Mexicans | 0.0 /100 | #295 | Tragic 16.6% |
| Hispanics or Latinos | 0.0 /100 | #296 | Tragic 16.6% |
| Immigrants | Guatemala | 0.0 /100 | #297 | Tragic 16.6% |
| Blackfeet | 0.0 /100 | #298 | Tragic 16.7% |
| Spanish Americans | 0.0 /100 | #299 | Tragic 16.7% |
| U.S. Virgin Islanders | 0.0 /100 | #300 | Tragic 16.7% |
| Immigrants | Congo | 0.0 /100 | #301 | Tragic 16.7% |
| Alaska Natives | 0.0 /100 | #302 | Tragic 16.8% |
| Immigrants | Mexico | 0.0 /100 | #303 | Tragic 16.8% |
| Hondurans | 0.0 /100 | #304 | Tragic 16.9% |
| Immigrants | Cabo Verde | 0.0 /100 | #305 | Tragic 16.9% |
| Chickasaw | 0.0 /100 | #306 | Tragic 17.0% |