Immigrants from Philippines vs Immigrants from Denmark Child Poverty Under the Age of 5
COMPARE
Immigrants from Philippines
Immigrants from Denmark
Child Poverty Under the Age of 5
Child Poverty Under the Age of 5 Comparison
Immigrants from Philippines
Immigrants from Denmark
14.7%
CHILD POVERTY UNDER THE AGE OF 5
99.7/ 100
METRIC RATING
44th/ 347
METRIC RANK
16.0%
CHILD POVERTY UNDER THE AGE OF 5
93.4/ 100
METRIC RATING
118th/ 347
METRIC RANK
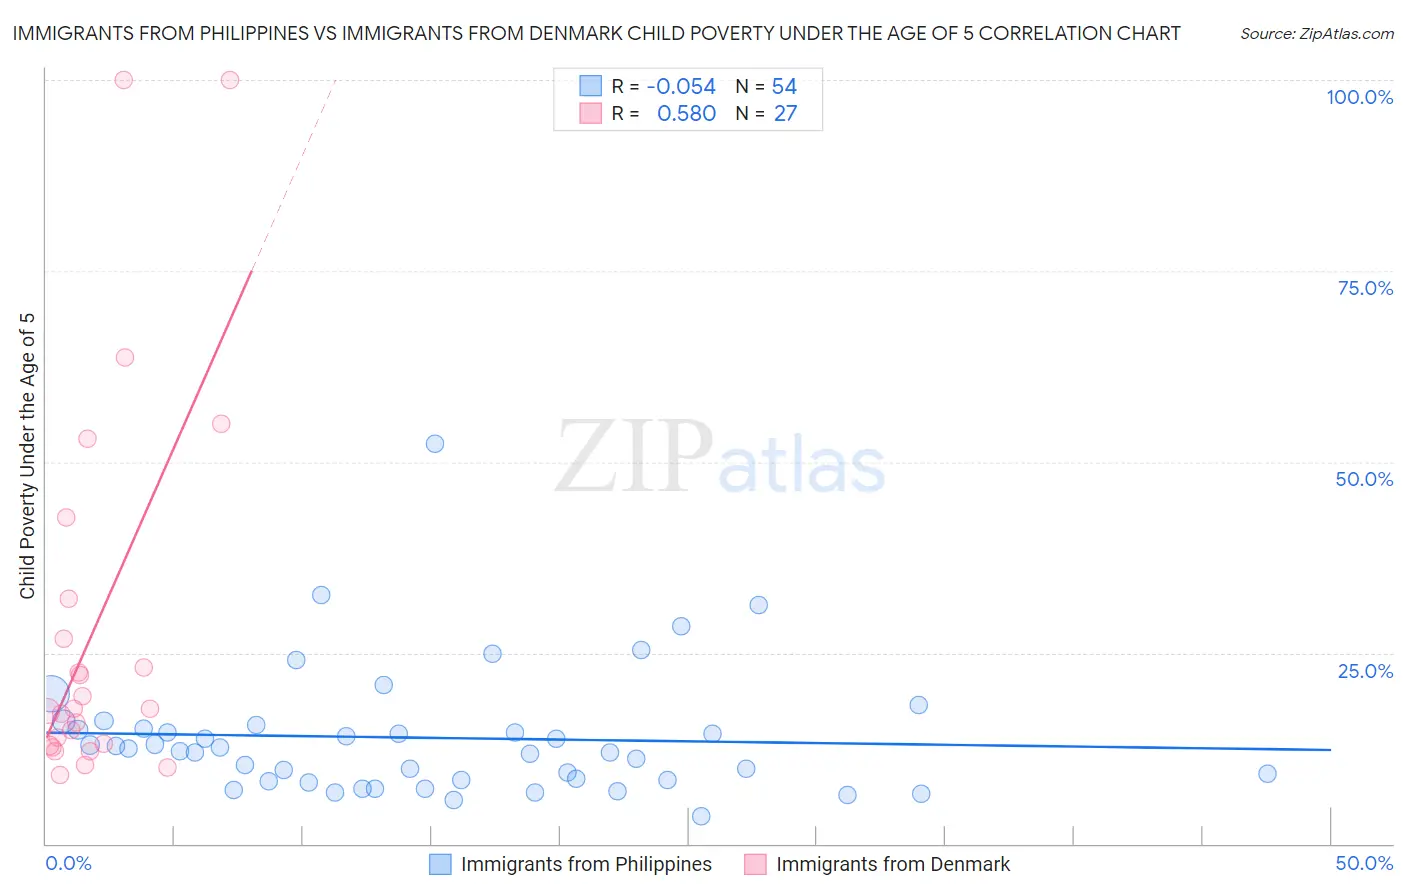
Immigrants from Philippines vs Immigrants from Denmark Child Poverty Under the Age of 5 Correlation Chart
The statistical analysis conducted on geographies consisting of 449,552,748 people shows a slight negative correlation between the proportion of Immigrants from Philippines and poverty level among children under the age of 5 in the United States with a correlation coefficient (R) of -0.054 and weighted average of 14.7%. Similarly, the statistical analysis conducted on geographies consisting of 133,042,864 people shows a substantial positive correlation between the proportion of Immigrants from Denmark and poverty level among children under the age of 5 in the United States with a correlation coefficient (R) of 0.580 and weighted average of 16.0%, a difference of 9.1%.
Child Poverty Under the Age of 5 Correlation Summary
| Measurement | Immigrants from Philippines | Immigrants from Denmark |
| Minimum | 3.7% | 9.1% |
| Maximum | 52.4% | 100.0% |
| Range | 48.7% | 90.9% |
| Mean | 13.9% | 28.4% |
| Median | 12.3% | 17.6% |
| Interquartile 25% (IQ1) | 8.3% | 12.9% |
| Interquartile 75% (IQ3) | 15.1% | 32.1% |
| Interquartile Range (IQR) | 6.8% | 19.2% |
| Standard Deviation (Sample) | 8.4% | 25.2% |
| Standard Deviation (Population) | 8.3% | 24.8% |
Similar Demographics by Child Poverty Under the Age of 5
Demographics Similar to Immigrants from Philippines by Child Poverty Under the Age of 5
In terms of child poverty under the age of 5, the demographic groups most similar to Immigrants from Philippines are Soviet Union (14.7%, a difference of 0.13%), Immigrants from Greece (14.7%, a difference of 0.13%), Laotian (14.7%, a difference of 0.13%), Tsimshian (14.7%, a difference of 0.20%), and Immigrants from Belarus (14.7%, a difference of 0.29%).
| Demographics | Rating | Rank | Child Poverty Under the Age of 5 |
| Turks | 99.7 /100 | #37 | Exceptional 14.6% |
| Eastern Europeans | 99.7 /100 | #38 | Exceptional 14.6% |
| Norwegians | 99.7 /100 | #39 | Exceptional 14.6% |
| Immigrants | Australia | 99.7 /100 | #40 | Exceptional 14.6% |
| Immigrants | Belarus | 99.7 /100 | #41 | Exceptional 14.7% |
| Soviet Union | 99.7 /100 | #42 | Exceptional 14.7% |
| Immigrants | Greece | 99.7 /100 | #43 | Exceptional 14.7% |
| Immigrants | Philippines | 99.7 /100 | #44 | Exceptional 14.7% |
| Laotians | 99.6 /100 | #45 | Exceptional 14.7% |
| Tsimshian | 99.6 /100 | #46 | Exceptional 14.7% |
| Russians | 99.6 /100 | #47 | Exceptional 14.8% |
| Immigrants | Czechoslovakia | 99.6 /100 | #48 | Exceptional 14.8% |
| Immigrants | Bulgaria | 99.6 /100 | #49 | Exceptional 14.8% |
| Immigrants | Northern Europe | 99.6 /100 | #50 | Exceptional 14.8% |
| Estonians | 99.6 /100 | #51 | Exceptional 14.8% |
Demographics Similar to Immigrants from Denmark by Child Poverty Under the Age of 5
In terms of child poverty under the age of 5, the demographic groups most similar to Immigrants from Denmark are Basque (16.0%, a difference of 0.0%), Immigrants from Austria (16.0%, a difference of 0.020%), Immigrants from Jordan (16.1%, a difference of 0.11%), Albanian (16.0%, a difference of 0.18%), and Immigrants from Kuwait (16.0%, a difference of 0.21%).
| Demographics | Rating | Rank | Child Poverty Under the Age of 5 |
| Pakistanis | 94.2 /100 | #111 | Exceptional 16.0% |
| Peruvians | 94.1 /100 | #112 | Exceptional 16.0% |
| Puget Sound Salish | 94.1 /100 | #113 | Exceptional 16.0% |
| Immigrants | Kuwait | 93.9 /100 | #114 | Exceptional 16.0% |
| Albanians | 93.8 /100 | #115 | Exceptional 16.0% |
| Immigrants | Austria | 93.5 /100 | #116 | Exceptional 16.0% |
| Basques | 93.4 /100 | #117 | Exceptional 16.0% |
| Immigrants | Denmark | 93.4 /100 | #118 | Exceptional 16.0% |
| Immigrants | Jordan | 93.2 /100 | #119 | Exceptional 16.1% |
| Immigrants | Peru | 92.6 /100 | #120 | Exceptional 16.1% |
| Mongolians | 92.5 /100 | #121 | Exceptional 16.1% |
| Immigrants | Southern Europe | 92.0 /100 | #122 | Exceptional 16.1% |
| Austrians | 92.0 /100 | #123 | Exceptional 16.1% |
| Swiss | 92.0 /100 | #124 | Exceptional 16.1% |
| Native Hawaiians | 91.8 /100 | #125 | Exceptional 16.2% |