Immigrants from Philippines vs Costa Rican Child Poverty Under the Age of 5
COMPARE
Immigrants from Philippines
Costa Rican
Child Poverty Under the Age of 5
Child Poverty Under the Age of 5 Comparison
Immigrants from Philippines
Costa Ricans
14.7%
CHILD POVERTY UNDER THE AGE OF 5
99.7/ 100
METRIC RATING
44th/ 347
METRIC RANK
16.9%
CHILD POVERTY UNDER THE AGE OF 5
69.8/ 100
METRIC RATING
162nd/ 347
METRIC RANK
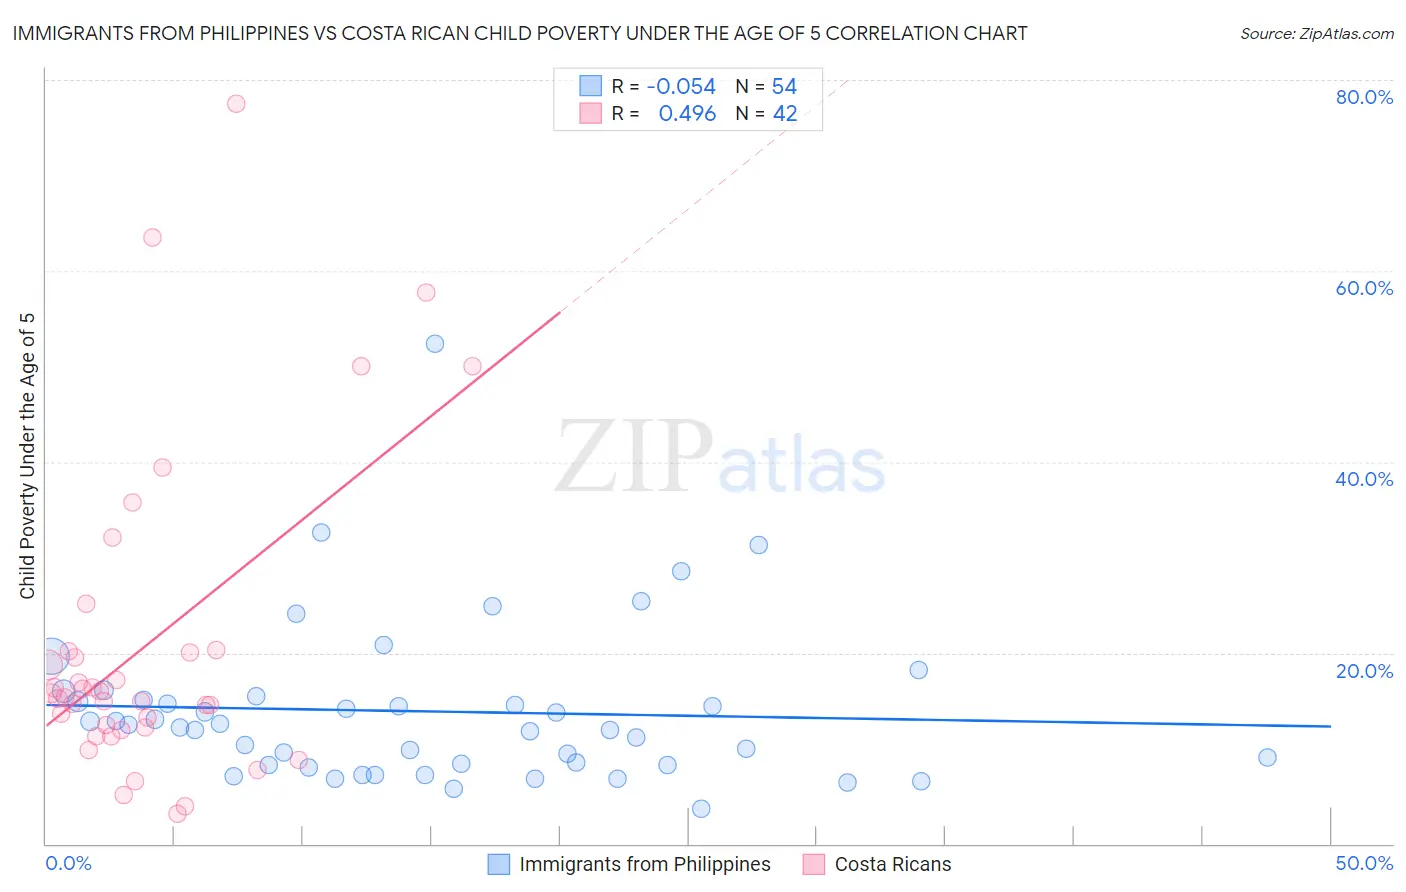
Immigrants from Philippines vs Costa Rican Child Poverty Under the Age of 5 Correlation Chart
The statistical analysis conducted on geographies consisting of 449,552,748 people shows a slight negative correlation between the proportion of Immigrants from Philippines and poverty level among children under the age of 5 in the United States with a correlation coefficient (R) of -0.054 and weighted average of 14.7%. Similarly, the statistical analysis conducted on geographies consisting of 247,728,653 people shows a moderate positive correlation between the proportion of Costa Ricans and poverty level among children under the age of 5 in the United States with a correlation coefficient (R) of 0.496 and weighted average of 16.9%, a difference of 14.6%.
Child Poverty Under the Age of 5 Correlation Summary
| Measurement | Immigrants from Philippines | Costa Rican |
| Minimum | 3.7% | 3.1% |
| Maximum | 52.4% | 77.6% |
| Range | 48.7% | 74.4% |
| Mean | 13.9% | 21.0% |
| Median | 12.3% | 15.6% |
| Interquartile 25% (IQ1) | 8.3% | 12.2% |
| Interquartile 75% (IQ3) | 15.1% | 20.2% |
| Interquartile Range (IQR) | 6.8% | 8.0% |
| Standard Deviation (Sample) | 8.4% | 16.5% |
| Standard Deviation (Population) | 8.3% | 16.3% |
Similar Demographics by Child Poverty Under the Age of 5
Demographics Similar to Immigrants from Philippines by Child Poverty Under the Age of 5
In terms of child poverty under the age of 5, the demographic groups most similar to Immigrants from Philippines are Soviet Union (14.7%, a difference of 0.13%), Immigrants from Greece (14.7%, a difference of 0.13%), Laotian (14.7%, a difference of 0.13%), Tsimshian (14.7%, a difference of 0.20%), and Immigrants from Belarus (14.7%, a difference of 0.29%).
| Demographics | Rating | Rank | Child Poverty Under the Age of 5 |
| Turks | 99.7 /100 | #37 | Exceptional 14.6% |
| Eastern Europeans | 99.7 /100 | #38 | Exceptional 14.6% |
| Norwegians | 99.7 /100 | #39 | Exceptional 14.6% |
| Immigrants | Australia | 99.7 /100 | #40 | Exceptional 14.6% |
| Immigrants | Belarus | 99.7 /100 | #41 | Exceptional 14.7% |
| Soviet Union | 99.7 /100 | #42 | Exceptional 14.7% |
| Immigrants | Greece | 99.7 /100 | #43 | Exceptional 14.7% |
| Immigrants | Philippines | 99.7 /100 | #44 | Exceptional 14.7% |
| Laotians | 99.6 /100 | #45 | Exceptional 14.7% |
| Tsimshian | 99.6 /100 | #46 | Exceptional 14.7% |
| Russians | 99.6 /100 | #47 | Exceptional 14.8% |
| Immigrants | Czechoslovakia | 99.6 /100 | #48 | Exceptional 14.8% |
| Immigrants | Bulgaria | 99.6 /100 | #49 | Exceptional 14.8% |
| Immigrants | Northern Europe | 99.6 /100 | #50 | Exceptional 14.8% |
| Estonians | 99.6 /100 | #51 | Exceptional 14.8% |
Demographics Similar to Costa Ricans by Child Poverty Under the Age of 5
In terms of child poverty under the age of 5, the demographic groups most similar to Costa Ricans are English (16.8%, a difference of 0.060%), Scottish (16.9%, a difference of 0.15%), Immigrants from Oceania (16.9%, a difference of 0.27%), Irish (16.8%, a difference of 0.28%), and Immigrants from Syria (16.8%, a difference of 0.31%).
| Demographics | Rating | Rank | Child Poverty Under the Age of 5 |
| South Americans | 75.1 /100 | #155 | Good 16.7% |
| Afghans | 74.4 /100 | #156 | Good 16.8% |
| Venezuelans | 73.7 /100 | #157 | Good 16.8% |
| Czechoslovakians | 72.5 /100 | #158 | Good 16.8% |
| Immigrants | Syria | 72.3 /100 | #159 | Good 16.8% |
| Irish | 72.0 /100 | #160 | Good 16.8% |
| English | 70.4 /100 | #161 | Good 16.8% |
| Costa Ricans | 69.8 /100 | #162 | Good 16.9% |
| Scottish | 68.6 /100 | #163 | Good 16.9% |
| Immigrants | Oceania | 67.6 /100 | #164 | Good 16.9% |
| Immigrants | Colombia | 66.9 /100 | #165 | Good 16.9% |
| Slavs | 64.0 /100 | #166 | Good 17.0% |
| Immigrants | Uzbekistan | 62.0 /100 | #167 | Good 17.0% |
| Uruguayans | 60.5 /100 | #168 | Good 17.0% |
| Immigrants | South America | 60.0 /100 | #169 | Good 17.1% |