Immigrants from Peru vs Immigrants from Western Asia Family Poverty
COMPARE
Immigrants from Peru
Immigrants from Western Asia
Family Poverty
Family Poverty Comparison
Immigrants from Peru
Immigrants from Western Asia
8.9%
FAMILY POVERTY
57.5/ 100
METRIC RATING
172nd/ 347
METRIC RANK
9.3%
FAMILY POVERTY
28.2/ 100
METRIC RATING
193rd/ 347
METRIC RANK
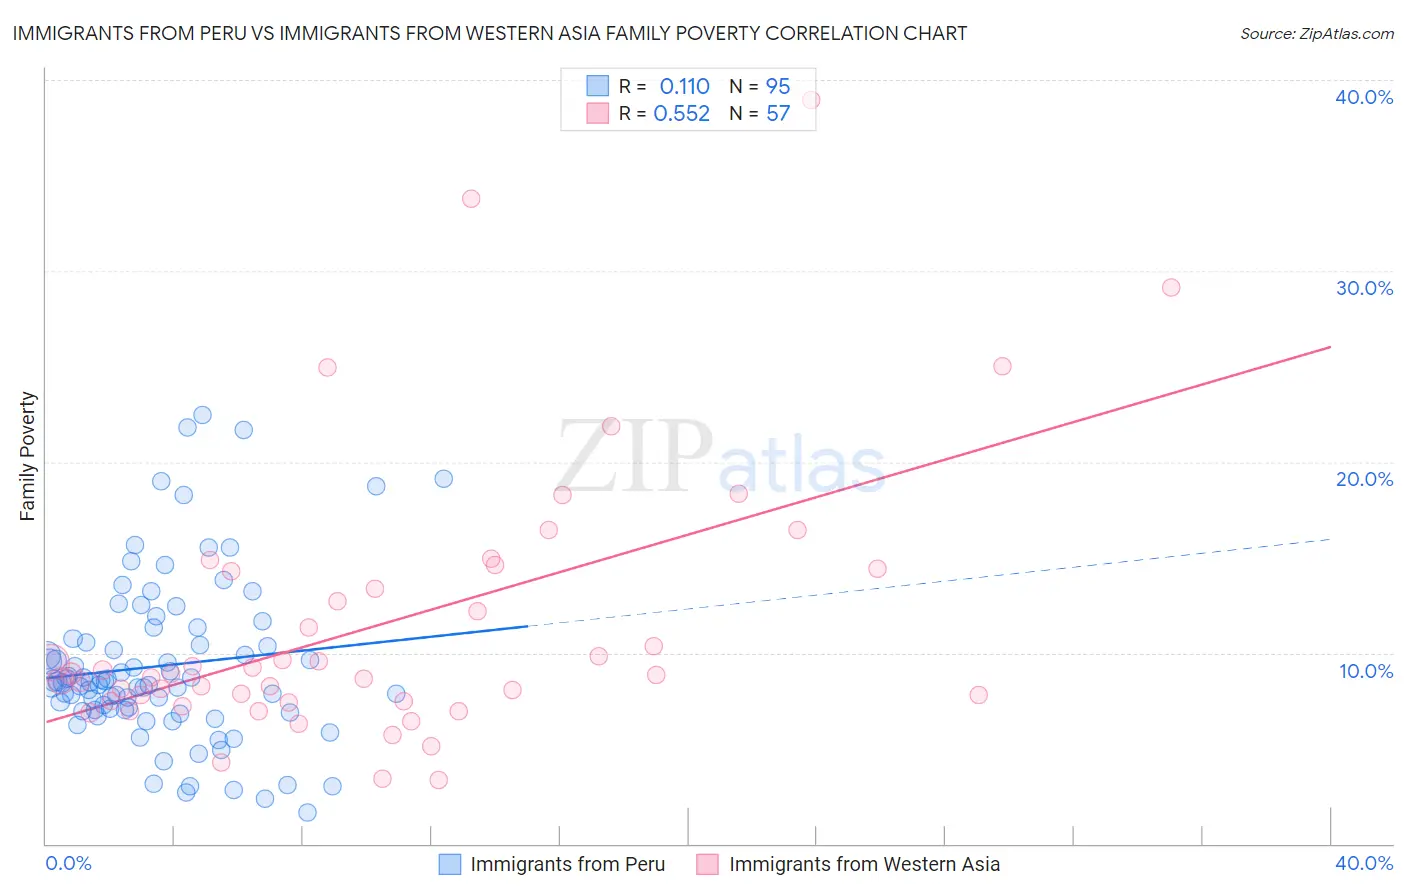
Immigrants from Peru vs Immigrants from Western Asia Family Poverty Correlation Chart
The statistical analysis conducted on geographies consisting of 328,434,488 people shows a poor positive correlation between the proportion of Immigrants from Peru and poverty level among families in the United States with a correlation coefficient (R) of 0.110 and weighted average of 8.9%. Similarly, the statistical analysis conducted on geographies consisting of 403,212,379 people shows a substantial positive correlation between the proportion of Immigrants from Western Asia and poverty level among families in the United States with a correlation coefficient (R) of 0.552 and weighted average of 9.3%, a difference of 4.1%.
Family Poverty Correlation Summary
| Measurement | Immigrants from Peru | Immigrants from Western Asia |
| Minimum | 1.6% | 3.3% |
| Maximum | 22.5% | 38.9% |
| Range | 20.8% | 35.6% |
| Mean | 9.3% | 11.6% |
| Median | 8.5% | 8.9% |
| Interquartile 25% (IQ1) | 7.0% | 7.5% |
| Interquartile 75% (IQ3) | 10.8% | 14.3% |
| Interquartile Range (IQR) | 3.8% | 6.9% |
| Standard Deviation (Sample) | 4.3% | 7.2% |
| Standard Deviation (Population) | 4.3% | 7.1% |
Similar Demographics by Family Poverty
Demographics Similar to Immigrants from Peru by Family Poverty
In terms of family poverty, the demographic groups most similar to Immigrants from Peru are Lebanese (8.9%, a difference of 0.010%), Kenyan (8.9%, a difference of 0.090%), Immigrants from Fiji (8.9%, a difference of 0.15%), Immigrants from Chile (8.9%, a difference of 0.29%), and Israeli (8.9%, a difference of 0.63%).
| Demographics | Rating | Rank | Family Poverty |
| Guamanians/Chamorros | 64.7 /100 | #165 | Good 8.8% |
| Afghans | 63.5 /100 | #166 | Good 8.8% |
| Immigrants | Ethiopia | 62.5 /100 | #167 | Good 8.9% |
| Israelis | 62.1 /100 | #168 | Good 8.9% |
| Immigrants | Chile | 59.6 /100 | #169 | Average 8.9% |
| Kenyans | 58.2 /100 | #170 | Average 8.9% |
| Lebanese | 57.6 /100 | #171 | Average 8.9% |
| Immigrants | Peru | 57.5 /100 | #172 | Average 8.9% |
| Immigrants | Fiji | 56.4 /100 | #173 | Average 8.9% |
| Immigrants | Albania | 50.0 /100 | #174 | Average 9.0% |
| Costa Ricans | 49.3 /100 | #175 | Average 9.0% |
| Immigrants | Syria | 47.5 /100 | #176 | Average 9.0% |
| Hawaiians | 47.2 /100 | #177 | Average 9.0% |
| Immigrants | Cameroon | 47.1 /100 | #178 | Average 9.0% |
| Immigrants | Iraq | 44.4 /100 | #179 | Average 9.1% |
Demographics Similar to Immigrants from Western Asia by Family Poverty
In terms of family poverty, the demographic groups most similar to Immigrants from Western Asia are South American (9.3%, a difference of 0.020%), Spanish (9.3%, a difference of 0.070%), Ugandan (9.3%, a difference of 0.080%), Venezuelan (9.3%, a difference of 0.13%), and Immigrants from Venezuela (9.3%, a difference of 0.34%).
| Demographics | Rating | Rank | Family Poverty |
| Colombians | 36.1 /100 | #186 | Fair 9.2% |
| Delaware | 35.4 /100 | #187 | Fair 9.2% |
| Immigrants | Kenya | 34.0 /100 | #188 | Fair 9.2% |
| Immigrants | Afghanistan | 32.1 /100 | #189 | Fair 9.2% |
| Arabs | 31.5 /100 | #190 | Fair 9.2% |
| Ugandans | 28.7 /100 | #191 | Fair 9.3% |
| Spanish | 28.7 /100 | #192 | Fair 9.3% |
| Immigrants | Western Asia | 28.2 /100 | #193 | Fair 9.3% |
| South Americans | 28.1 /100 | #194 | Fair 9.3% |
| Venezuelans | 27.4 /100 | #195 | Fair 9.3% |
| Immigrants | Venezuela | 26.1 /100 | #196 | Fair 9.3% |
| Immigrants | Colombia | 24.4 /100 | #197 | Fair 9.3% |
| Iraqis | 24.2 /100 | #198 | Fair 9.3% |
| Spaniards | 22.8 /100 | #199 | Fair 9.4% |
| Immigrants | Costa Rica | 21.7 /100 | #200 | Fair 9.4% |