Immigrants from Peru vs Guatemalan Female Poverty Among 18-24 Year Olds
COMPARE
Immigrants from Peru
Guatemalan
Female Poverty Among 18-24 Year Olds
Female Poverty Among 18-24 Year Olds Comparison
Immigrants from Peru
Guatemalans
16.9%
FEMALE POVERTY AMONG 18-24 YEAR OLDS
100.0/ 100
METRIC RATING
9th/ 347
METRIC RANK
20.7%
FEMALE POVERTY AMONG 18-24 YEAR OLDS
8.1/ 100
METRIC RATING
222nd/ 347
METRIC RANK
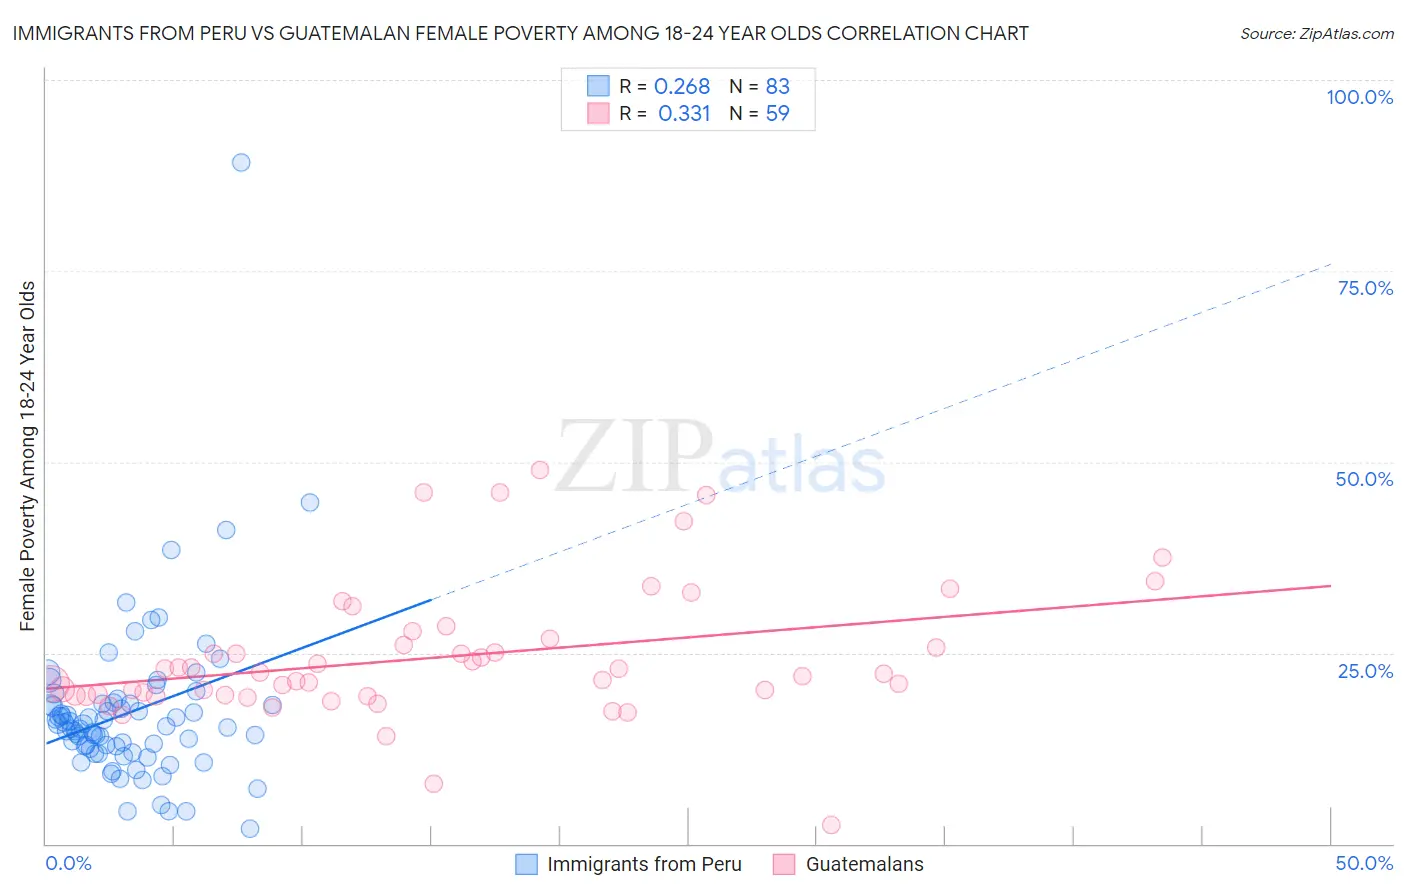
Immigrants from Peru vs Guatemalan Female Poverty Among 18-24 Year Olds Correlation Chart
The statistical analysis conducted on geographies consisting of 322,984,963 people shows a weak positive correlation between the proportion of Immigrants from Peru and poverty level among females between the ages 18 and 24 in the United States with a correlation coefficient (R) of 0.268 and weighted average of 16.9%. Similarly, the statistical analysis conducted on geographies consisting of 400,967,601 people shows a mild positive correlation between the proportion of Guatemalans and poverty level among females between the ages 18 and 24 in the United States with a correlation coefficient (R) of 0.331 and weighted average of 20.7%, a difference of 22.7%.
Female Poverty Among 18-24 Year Olds Correlation Summary
| Measurement | Immigrants from Peru | Guatemalan |
| Minimum | 2.0% | 2.4% |
| Maximum | 89.2% | 49.0% |
| Range | 87.2% | 46.6% |
| Mean | 17.2% | 24.4% |
| Median | 15.3% | 22.2% |
| Interquartile 25% (IQ1) | 12.5% | 19.4% |
| Interquartile 75% (IQ3) | 18.4% | 26.9% |
| Interquartile Range (IQR) | 5.9% | 7.5% |
| Standard Deviation (Sample) | 10.9% | 8.8% |
| Standard Deviation (Population) | 10.9% | 8.7% |
Similar Demographics by Female Poverty Among 18-24 Year Olds
Demographics Similar to Immigrants from Peru by Female Poverty Among 18-24 Year Olds
In terms of female poverty among 18-24 year olds, the demographic groups most similar to Immigrants from Peru are Korean (16.9%, a difference of 0.36%), Thai (17.0%, a difference of 0.63%), Immigrants from Pakistan (17.0%, a difference of 0.72%), Immigrants from Bolivia (16.7%, a difference of 0.84%), and Immigrants from the Azores (16.7%, a difference of 1.1%).
| Demographics | Rating | Rank | Female Poverty Among 18-24 Year Olds |
| Chinese | 100.0 /100 | #2 | Exceptional 16.2% |
| Immigrants | Cuba | 100.0 /100 | #3 | Exceptional 16.4% |
| Immigrants | India | 100.0 /100 | #4 | Exceptional 16.4% |
| Immigrants | Portugal | 100.0 /100 | #5 | Exceptional 16.5% |
| Immigrants | Philippines | 100.0 /100 | #6 | Exceptional 16.7% |
| Immigrants | Azores | 100.0 /100 | #7 | Exceptional 16.7% |
| Immigrants | Bolivia | 100.0 /100 | #8 | Exceptional 16.7% |
| Immigrants | Peru | 100.0 /100 | #9 | Exceptional 16.9% |
| Koreans | 100.0 /100 | #10 | Exceptional 16.9% |
| Thais | 100.0 /100 | #11 | Exceptional 17.0% |
| Immigrants | Pakistan | 100.0 /100 | #12 | Exceptional 17.0% |
| Immigrants | Poland | 100.0 /100 | #13 | Exceptional 17.1% |
| Tongans | 100.0 /100 | #14 | Exceptional 17.1% |
| Cubans | 100.0 /100 | #15 | Exceptional 17.2% |
| Peruvians | 100.0 /100 | #16 | Exceptional 17.2% |
Demographics Similar to Guatemalans by Female Poverty Among 18-24 Year Olds
In terms of female poverty among 18-24 year olds, the demographic groups most similar to Guatemalans are French (20.7%, a difference of 0.030%), Immigrants from Liberia (20.7%, a difference of 0.070%), Norwegian (20.7%, a difference of 0.13%), Barbadian (20.7%, a difference of 0.14%), and Estonian (20.7%, a difference of 0.15%).
| Demographics | Rating | Rank | Female Poverty Among 18-24 Year Olds |
| Spanish | 10.4 /100 | #215 | Poor 20.6% |
| Immigrants | Western Africa | 10.2 /100 | #216 | Poor 20.6% |
| Immigrants | Laos | 9.7 /100 | #217 | Tragic 20.6% |
| Immigrants | Nepal | 9.6 /100 | #218 | Tragic 20.7% |
| Immigrants | Micronesia | 9.6 /100 | #219 | Tragic 20.7% |
| British | 9.4 /100 | #220 | Tragic 20.7% |
| Barbadians | 9.0 /100 | #221 | Tragic 20.7% |
| Guatemalans | 8.1 /100 | #222 | Tragic 20.7% |
| French | 7.9 /100 | #223 | Tragic 20.7% |
| Immigrants | Liberia | 7.6 /100 | #224 | Tragic 20.7% |
| Norwegians | 7.3 /100 | #225 | Tragic 20.7% |
| Estonians | 7.2 /100 | #226 | Tragic 20.7% |
| Immigrants | Sweden | 6.8 /100 | #227 | Tragic 20.7% |
| Ghanaians | 6.5 /100 | #228 | Tragic 20.8% |
| Australians | 6.1 /100 | #229 | Tragic 20.8% |