Immigrants from Panama vs Immigrants from Ethiopia Child Poverty Under the Age of 16

COMPARE

Immigrants from Panama
Race
Ancestry
AfghanAfricanAlaska NativeAlaskan AthabascanAlbanianAleutAlsatianAmericanApacheArabArapahoArgentineanArmenianAssyrian/Chaldean/SyriacAustralianAustrianBahamianBangladeshiBarbadianBasqueBelgianBelizeanBermudanBhutaneseBlackfeetBolivianBrazilianBritishBritish West IndianBulgarianBurmeseCajunCambodianCanadianCape VerdeanCarpatho RusynCelticCentral AmericanCentral American IndianCherokeeCheyenneChickasawChileanChineseChippewaChoctawColombianColvilleComancheCosta RicanCreeCreekCroatianCrowCubanCypriotCzechCzechoslovakianDanishDelawareDominicanDutchDutch West IndianEastern EuropeanEcuadorianEgyptianEnglishEstonianEthiopianEuropeanFijianFilipinoFinnishFrenchFrench American IndianFrench CanadianGermanGerman RussianGhanaianGreekGuamanian/ChamorroGuatemalanGuyaneseHaitianHmongHonduranHopiHoumaHungarianIcelanderIndian (Asian)IndonesianInupiatIranianIraqiIrishIroquoisIsraeliItalianJamaicanJapaneseJordanianKenyanKiowaKoreanLaotianLatvianLebaneseLiberianLithuanianLumbeeLuxembourgerMacedonianMalaysianMalteseMarshalleseMenomineeMexicanMexican American IndianMongolianMoroccanNative HawaiianNavajoNepaleseNew ZealanderNicaraguanNigerianNorthern EuropeanNorwegianOkinawanOsageOttawaPaiutePakistaniPalestinianPanamanianParaguayanPennsylvania GermanPeruvianPimaPolishPortuguesePotawatomiPuebloPuerto RicanPuget Sound SalishRomanianRussianSalvadoranSamoanScandinavianScotch-IrishScottishSeminoleSenegaleseSerbianShoshoneSierra LeoneanSiouxSlavicSlovakSloveneSomaliSouth AfricanSouth AmericanSouth American IndianSoviet UnionSpaniardSpanishSpanish AmericanSpanish American IndianSri LankanSubsaharan AfricanSudaneseSwedishSwissSyrianTaiwaneseThaiTlingit-HaidaTohono O'OdhamTonganTrinidadian and TobagonianTsimshianTurkishU.S. Virgin IslanderUgandanUkrainianUruguayanUteVenezuelanVietnameseWelshWest IndianYakamaYaquiYugoslavianYumanYup'ikZimbabwean
Immigration
NonimmigrantsImmigrantsAfghanistanAfricaAlbaniaArgentinaArmeniaAsiaAustraliaAustriaBahamasBangladeshBarbadosBelarusBelgiumBelizeBoliviaBosnia and HerzegovinaBrazilBulgariaBurma/MyanmarCabo VerdeCambodiaCameroonCanadaCaribbeanCentral AmericaChileChinaColombiaCongoCosta RicaCroatiaCubaCzechoslovakiaDenmarkDominicaDominican RepublicEastern AfricaEastern AsiaEastern EuropeEcuadorEgyptEl SalvadorEnglandEritreaEuropeFijiFranceGermanyGhanaGreeceGrenadaGuatemalaGuyanaHaitiHondurasHong KongHungaryIndiaIndonesiaIranIraqIrelandIsraelItalyJamaicaJapanJordanKazakhstanKenyaKoreaKuwaitLaosLatin AmericaLatviaLebanonLiberiaLithuaniaMalaysiaMexicoMicronesiaMiddle AfricaMoldovaMoroccoNepalNetherlandsNicaraguaNigeriaNorth AmericaNorth MacedoniaNorthern AfricaNorthern EuropeNorwayOceaniaPakistanPanamaPeruPhilippinesPolandPortugalRomaniaRussiaSaudi ArabiaScotlandSenegalSerbiaSierra LeoneSingaporeSomaliaSouth AfricaSouth AmericaSouth Central AsiaSouth Eastern AsiaSouthern EuropeSpainSri LankaSt. Vincent and the GrenadinesSudanSwedenSwitzerlandSyriaTaiwanThailandTrinidad and TobagoTurkeyUgandaUkraineUruguayUzbekistanVenezuelaVietnamWest IndiesWestern AfricaWestern AsiaWestern EuropeYemenZaireZimbabweAzores
Immigrants from Ethiopia
Race
Ancestry
AfghanAfricanAlaska NativeAlaskan AthabascanAlbanianAleutAlsatianAmericanApacheArabArapahoArgentineanArmenianAssyrian/Chaldean/SyriacAustralianAustrianBahamianBangladeshiBarbadianBasqueBelgianBelizeanBermudanBhutaneseBlackfeetBolivianBrazilianBritishBritish West IndianBulgarianBurmeseCajunCambodianCanadianCape VerdeanCarpatho RusynCelticCentral AmericanCentral American IndianCherokeeCheyenneChickasawChileanChineseChippewaChoctawColombianColvilleComancheCosta RicanCreeCreekCroatianCrowCubanCypriotCzechCzechoslovakianDanishDelawareDominicanDutchDutch West IndianEastern EuropeanEcuadorianEgyptianEnglishEstonianEthiopianEuropeanFijianFilipinoFinnishFrenchFrench American IndianFrench CanadianGermanGerman RussianGhanaianGreekGuamanian/ChamorroGuatemalanGuyaneseHaitianHmongHonduranHopiHoumaHungarianIcelanderIndian (Asian)IndonesianInupiatIranianIraqiIrishIroquoisIsraeliItalianJamaicanJapaneseJordanianKenyanKiowaKoreanLaotianLatvianLebaneseLiberianLithuanianLumbeeLuxembourgerMacedonianMalaysianMalteseMarshalleseMenomineeMexicanMexican American IndianMongolianMoroccanNative HawaiianNavajoNepaleseNew ZealanderNicaraguanNigerianNorthern EuropeanNorwegianOkinawanOsageOttawaPaiutePakistaniPalestinianPanamanianParaguayanPennsylvania GermanPeruvianPimaPolishPortuguesePotawatomiPuebloPuerto RicanPuget Sound SalishRomanianRussianSalvadoranSamoanScandinavianScotch-IrishScottishSeminoleSenegaleseSerbianShoshoneSierra LeoneanSiouxSlavicSlovakSloveneSomaliSouth AfricanSouth AmericanSouth American IndianSoviet UnionSpaniardSpanishSpanish AmericanSpanish American IndianSri LankanSubsaharan AfricanSudaneseSwedishSwissSyrianTaiwaneseThaiTlingit-HaidaTohono O'OdhamTonganTrinidadian and TobagonianTsimshianTurkishU.S. Virgin IslanderUgandanUkrainianUruguayanUteVenezuelanVietnameseWelshWest IndianYakamaYaquiYugoslavianYumanYup'ikZimbabwean
Immigration
NonimmigrantsImmigrantsAfghanistanAfricaAlbaniaArgentinaArmeniaAsiaAustraliaAustriaBahamasBangladeshBarbadosBelarusBelgiumBelizeBoliviaBosnia and HerzegovinaBrazilBulgariaBurma/MyanmarCabo VerdeCambodiaCameroonCanadaCaribbeanCentral AmericaChileChinaColombiaCongoCosta RicaCroatiaCubaCzechoslovakiaDenmarkDominicaDominican RepublicEastern AfricaEastern AsiaEastern EuropeEcuadorEgyptEl SalvadorEnglandEritreaEthiopiaEuropeFijiFranceGermanyGhanaGreeceGrenadaGuatemalaGuyanaHaitiHondurasHong KongHungaryIndiaIndonesiaIranIraqIrelandIsraelItalyJamaicaJapanJordanKazakhstanKenyaKoreaKuwaitLaosLatin AmericaLatviaLebanonLiberiaLithuaniaMalaysiaMexicoMicronesiaMiddle AfricaMoldovaMoroccoNepalNetherlandsNicaraguaNigeriaNorth AmericaNorth MacedoniaNorthern AfricaNorthern EuropeNorwayOceaniaPakistanPeruPhilippinesPolandPortugalRomaniaRussiaSaudi ArabiaScotlandSenegalSerbiaSierra LeoneSingaporeSomaliaSouth AfricaSouth AmericaSouth Central AsiaSouth Eastern AsiaSouthern EuropeSpainSri LankaSt. Vincent and the GrenadinesSudanSwedenSwitzerlandSyriaTaiwanThailandTrinidad and TobagoTurkeyUgandaUkraineUruguayUzbekistanVenezuelaVietnamWest IndiesWestern AfricaWestern AsiaWestern EuropeYemenZaireZimbabweAzores
Child Poverty Under the Age of 16
Income
Poverty
Unemployment
Labor Participation
Family Structure
Vehicle Availability
Education Level
Disability

Child Poverty Under the Age of 16 Comparison

Immigrants from Panama

Immigrants from Ethiopia

Tragic
Average
17.7%
CHILD POVERTY UNDER THE AGE OF 16
4.1/ 100
METRIC RATING
220th/ 347
METRIC RANK
16.4%
CHILD POVERTY UNDER THE AGE OF 16
42.3/ 100
METRIC RATING
178th/ 347
METRIC RANK

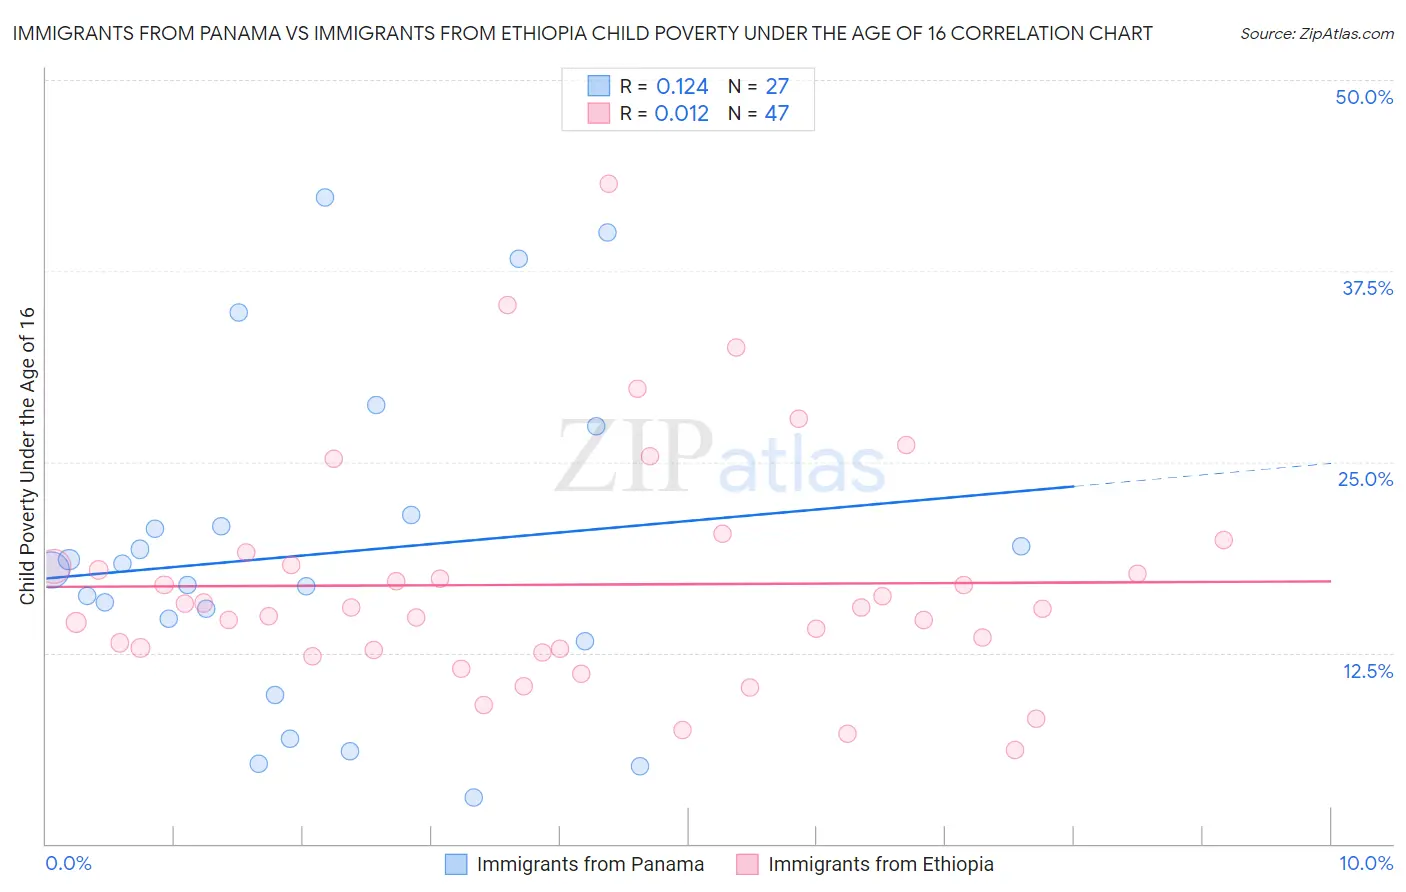
Immigrants from Panama vs Immigrants from Ethiopia Child Poverty Under the Age of 16 Correlation Chart

The statistical analysis conducted on geographies consisting of 220,562,489 people shows a poor positive correlation between the proportion of Immigrants from Panama and poverty level among children under the age of 16 in the United States with a correlation coefficient (R) of 0.124 and weighted average of 17.7%. Similarly, the statistical analysis conducted on geographies consisting of 210,738,801 people shows no correlation between the proportion of Immigrants from Ethiopia and poverty level among children under the age of 16 in the United States with a correlation coefficient (R) of 0.012 and weighted average of 16.4%, a difference of 8.5%.
Immigrants from Panama vs Immigrants from Ethiopia Child Poverty Under the Age of 16

Child Poverty Under the Age of 16 Correlation Summary

MeasurementImmigrants from PanamaImmigrants from Ethiopia
Minimum3.1%6.1%
Maximum42.3%43.2%
Range39.2%37.1%
Mean19.0%17.0%
Median17.9%15.5%
Interquartile 25% (IQ1)13.3%12.7%
Interquartile 75% (IQ3)21.5%18.2%
Interquartile Range (IQR)8.2%5.6%
Standard Deviation (Sample)10.6%7.5%
Standard Deviation (Population)10.4%7.4%

Similar Demographics by Child Poverty Under the Age of 16

Demographics Similar to Immigrants from Panama by Child Poverty Under the Age of 16

In terms of child poverty under the age of 16, the demographic groups most similar to Immigrants from Panama are Cuban (17.8%, a difference of 0.27%), Immigrants from Armenia (17.8%, a difference of 0.33%), Japanese (17.7%, a difference of 0.40%), Immigrants from Cambodia (17.8%, a difference of 0.57%), and Moroccan (17.6%, a difference of 0.77%).
DemographicsRating | RankChild Poverty Under the Age of 16
Immigrants | Azores
6.2
/100
|
#213
Tragic
17.5%
Iraqis
5.9
/100
|
#214
Tragic
17.5%
Malaysians
5.9
/100
|
#215
Tragic
17.5%
Sierra Leoneans
5.7
/100
|
#216
Tragic
17.6%
Immigrants | Eastern Africa
5.3
/100
|
#217
Tragic
17.6%
Moroccans
5.3
/100
|
#218
Tragic
17.6%
Japanese
4.7
/100
|
#219
Tragic
17.7%
Immigrants | Panama
4.1
/100
|
#220
Tragic
17.7%
Cubans
3.7
/100
|
#221
Tragic
17.8%
Immigrants | Armenia
3.6
/100
|
#222
Tragic
17.8%
Immigrants | Cambodia
3.3
/100
|
#223
Tragic
17.8%
Osage
3.1
/100
|
#224
Tragic
17.9%
Immigrants | Nonimmigrants
2.7
/100
|
#225
Tragic
17.9%
Bermudans
2.6
/100
|
#226
Tragic
18.0%
Immigrants | Africa
2.5
/100
|
#227
Tragic
18.0%

Demographics Similar to Immigrants from Ethiopia by Child Poverty Under the Age of 16

In terms of child poverty under the age of 16, the demographic groups most similar to Immigrants from Ethiopia are Immigrants from Syria (16.4%, a difference of 0.0%), South American Indian (16.4%, a difference of 0.060%), Ethiopian (16.3%, a difference of 0.13%), Immigrants from South America (16.4%, a difference of 0.18%), and Lebanese (16.3%, a difference of 0.43%).
DemographicsRating | RankChild Poverty Under the Age of 16
Hungarians
52.5
/100
|
#171
Average
16.2%
Afghans
52.3
/100
|
#172
Average
16.2%
Immigrants | Saudi Arabia
52.1
/100
|
#173
Average
16.2%
Whites/Caucasians
50.0
/100
|
#174
Average
16.2%
Scotch-Irish
47.1
/100
|
#175
Average
16.3%
Lebanese
45.9
/100
|
#176
Average
16.3%
Ethiopians
43.4
/100
|
#177
Average
16.3%
Immigrants | Ethiopia
42.3
/100
|
#178
Average
16.4%
Immigrants | Syria
42.3
/100
|
#179
Average
16.4%
South American Indians
41.8
/100
|
#180
Average
16.4%
Immigrants | South America
40.8
/100
|
#181
Average
16.4%
Hawaiians
38.2
/100
|
#182
Fair
16.4%
Celtics
38.2
/100
|
#183
Fair
16.4%
Immigrants | Western Asia
38.0
/100
|
#184
Fair
16.4%
Immigrants | Bosnia and Herzegovina
37.4
/100
|
#185
Fair
16.5%