Immigrants from Norway vs Immigrants from Western Europe Poverty
COMPARE
Immigrants from Norway
Immigrants from Western Europe
Poverty
Poverty Comparison
Immigrants from Norway
Immigrants from Western Europe
11.7%
POVERTY
88.0/ 100
METRIC RATING
126th/ 347
METRIC RANK
11.8%
POVERTY
85.2/ 100
METRIC RATING
133rd/ 347
METRIC RANK
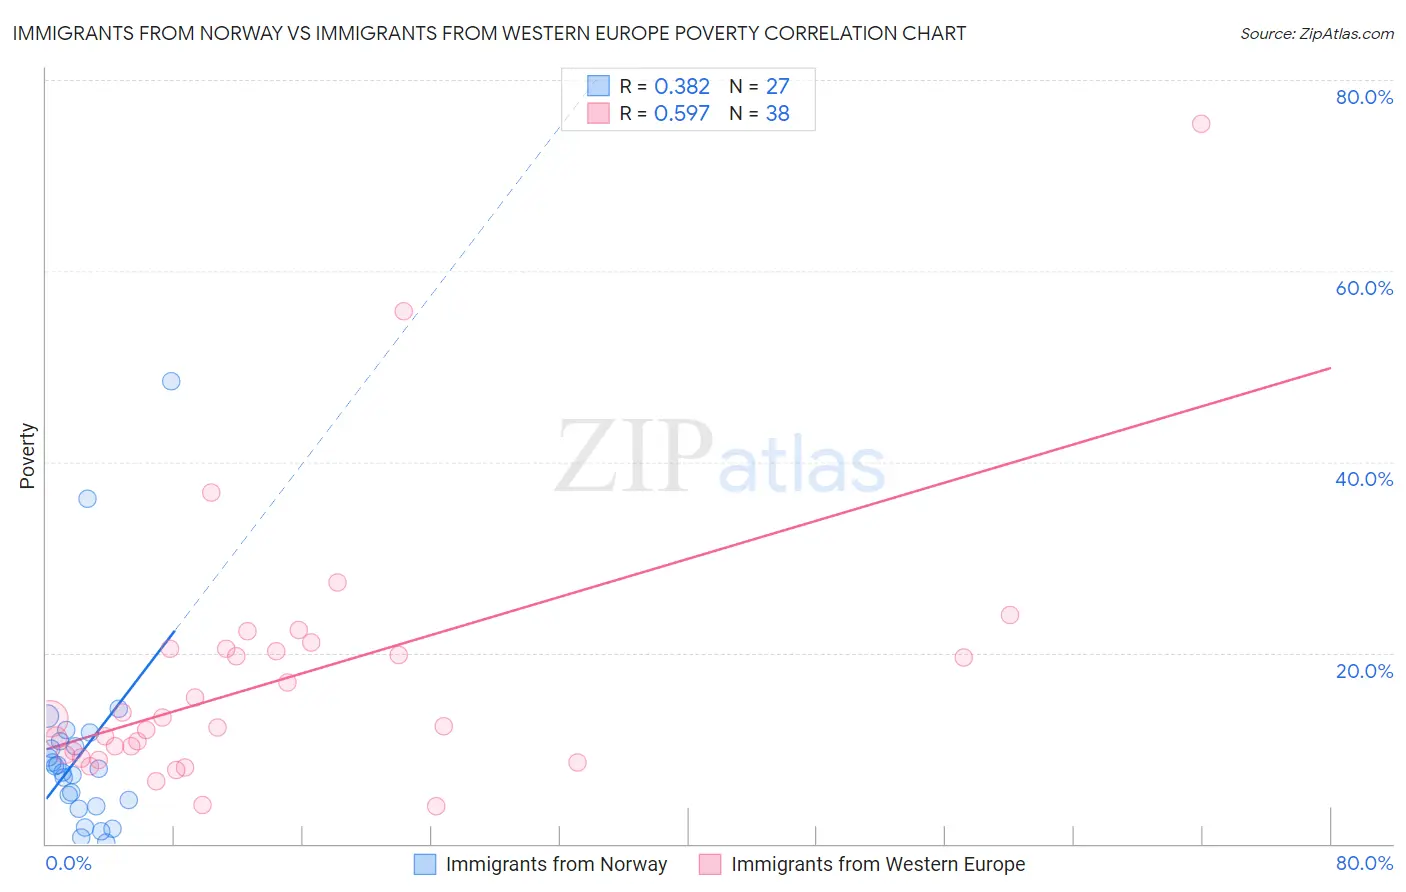
Immigrants from Norway vs Immigrants from Western Europe Poverty Correlation Chart
The statistical analysis conducted on geographies consisting of 116,687,358 people shows a mild positive correlation between the proportion of Immigrants from Norway and poverty level in the United States with a correlation coefficient (R) of 0.382 and weighted average of 11.7%. Similarly, the statistical analysis conducted on geographies consisting of 493,769,922 people shows a substantial positive correlation between the proportion of Immigrants from Western Europe and poverty level in the United States with a correlation coefficient (R) of 0.597 and weighted average of 11.8%, a difference of 0.62%.
Poverty Correlation Summary
| Measurement | Immigrants from Norway | Immigrants from Western Europe |
| Minimum | 0.18% | 3.9% |
| Maximum | 48.4% | 75.4% |
| Range | 48.3% | 71.5% |
| Mean | 9.6% | 17.1% |
| Median | 7.9% | 12.7% |
| Interquartile 25% (IQ1) | 3.9% | 9.3% |
| Interquartile 75% (IQ3) | 10.8% | 20.4% |
| Interquartile Range (IQR) | 6.9% | 11.1% |
| Standard Deviation (Sample) | 10.3% | 13.7% |
| Standard Deviation (Population) | 10.1% | 13.5% |
Demographics Similar to Immigrants from Norway and Immigrants from Western Europe by Poverty
In terms of poverty, the demographic groups most similar to Immigrants from Norway are Immigrants from Argentina (11.7%, a difference of 0.020%), Immigrants from Brazil (11.7%, a difference of 0.040%), Soviet Union (11.7%, a difference of 0.080%), Immigrants from Israel (11.7%, a difference of 0.14%), and Immigrants from Hungary (11.7%, a difference of 0.15%). Similarly, the demographic groups most similar to Immigrants from Western Europe are Yugoslavian (11.8%, a difference of 0.010%), Immigrants from Vietnam (11.8%, a difference of 0.020%), Peruvian (11.8%, a difference of 0.070%), French (11.8%, a difference of 0.19%), and Chilean (11.8%, a difference of 0.21%).
| Demographics | Rating | Rank | Poverty |
| Tlingit-Haida | 89.0 /100 | #119 | Excellent 11.7% |
| Immigrants | South Eastern Asia | 88.9 /100 | #120 | Excellent 11.7% |
| New Zealanders | 88.7 /100 | #121 | Excellent 11.7% |
| Puget Sound Salish | 88.7 /100 | #122 | Excellent 11.7% |
| Immigrants | Hungary | 88.6 /100 | #123 | Excellent 11.7% |
| Soviet Union | 88.4 /100 | #124 | Excellent 11.7% |
| Immigrants | Brazil | 88.2 /100 | #125 | Excellent 11.7% |
| Immigrants | Norway | 88.0 /100 | #126 | Excellent 11.7% |
| Immigrants | Argentina | 88.0 /100 | #127 | Excellent 11.7% |
| Immigrants | Israel | 87.4 /100 | #128 | Excellent 11.7% |
| South Africans | 87.0 /100 | #129 | Excellent 11.7% |
| Immigrants | Ukraine | 86.6 /100 | #130 | Excellent 11.8% |
| French | 86.1 /100 | #131 | Excellent 11.8% |
| Peruvians | 85.6 /100 | #132 | Excellent 11.8% |
| Immigrants | Western Europe | 85.2 /100 | #133 | Excellent 11.8% |
| Yugoslavians | 85.2 /100 | #134 | Excellent 11.8% |
| Immigrants | Vietnam | 85.2 /100 | #135 | Excellent 11.8% |
| Chileans | 84.2 /100 | #136 | Excellent 11.8% |
| Immigrants | Switzerland | 83.0 /100 | #137 | Excellent 11.8% |
| Immigrants | Jordan | 82.4 /100 | #138 | Excellent 11.9% |
| Pakistanis | 82.2 /100 | #139 | Excellent 11.9% |