Immigrants from Norway vs Immigrants from Syria Poverty
COMPARE
Immigrants from Norway
Immigrants from Syria
Poverty
Poverty Comparison
Immigrants from Norway
Immigrants from Syria
11.7%
POVERTY
88.0/ 100
METRIC RATING
126th/ 347
METRIC RANK
12.3%
POVERTY
47.5/ 100
METRIC RATING
177th/ 347
METRIC RANK
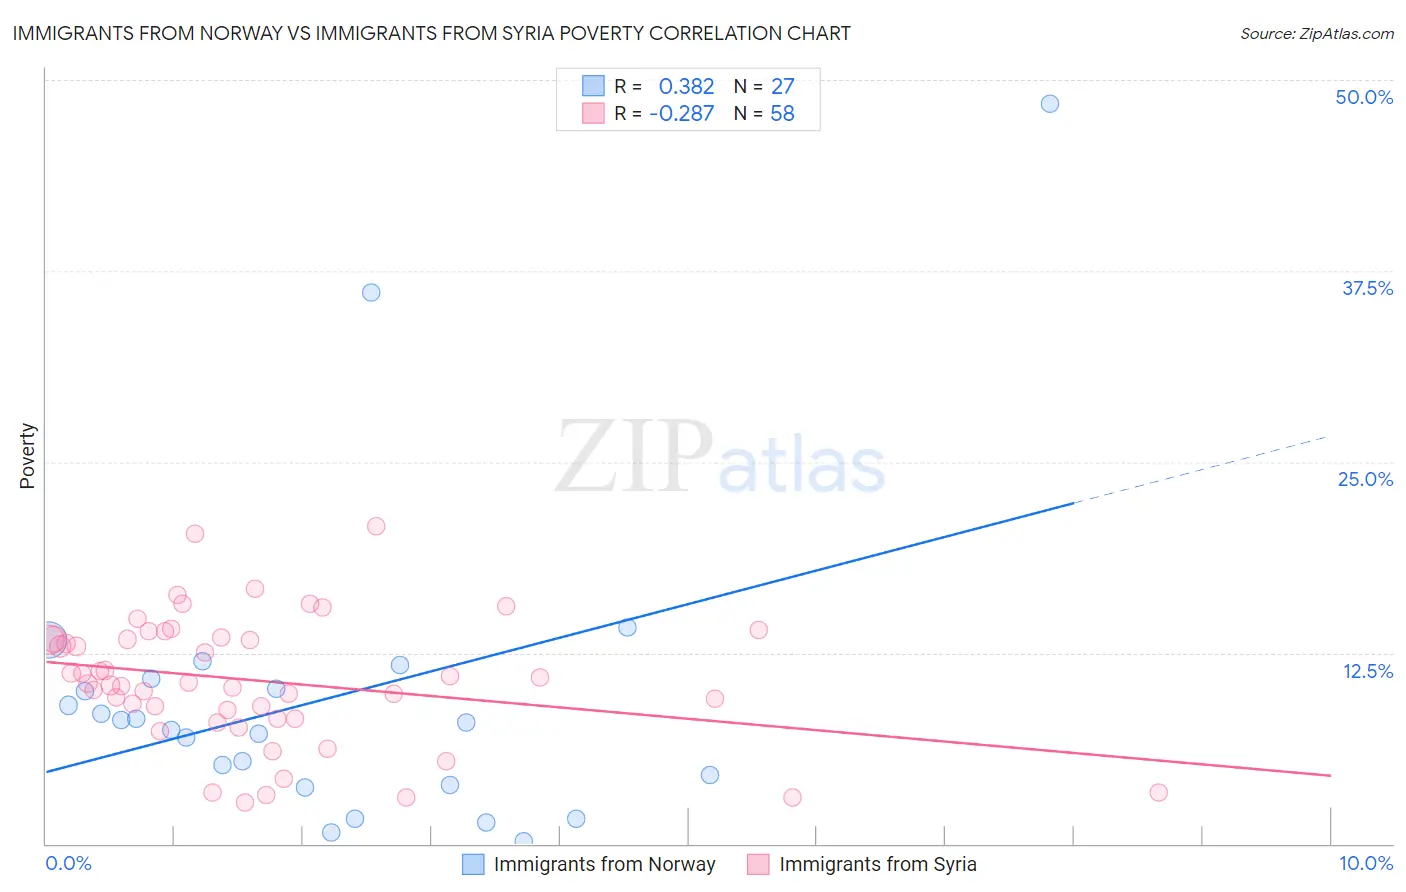
Immigrants from Norway vs Immigrants from Syria Poverty Correlation Chart
The statistical analysis conducted on geographies consisting of 116,687,358 people shows a mild positive correlation between the proportion of Immigrants from Norway and poverty level in the United States with a correlation coefficient (R) of 0.382 and weighted average of 11.7%. Similarly, the statistical analysis conducted on geographies consisting of 173,988,191 people shows a weak negative correlation between the proportion of Immigrants from Syria and poverty level in the United States with a correlation coefficient (R) of -0.286 and weighted average of 12.3%, a difference of 5.3%.
Poverty Correlation Summary
| Measurement | Immigrants from Norway | Immigrants from Syria |
| Minimum | 0.18% | 2.7% |
| Maximum | 48.4% | 20.8% |
| Range | 48.3% | 18.1% |
| Mean | 9.6% | 10.7% |
| Median | 7.9% | 10.5% |
| Interquartile 25% (IQ1) | 3.9% | 8.2% |
| Interquartile 75% (IQ3) | 10.8% | 13.4% |
| Interquartile Range (IQR) | 6.9% | 5.2% |
| Standard Deviation (Sample) | 10.3% | 4.2% |
| Standard Deviation (Population) | 10.1% | 4.1% |
Similar Demographics by Poverty
Demographics Similar to Immigrants from Norway by Poverty
In terms of poverty, the demographic groups most similar to Immigrants from Norway are Immigrants from Argentina (11.7%, a difference of 0.020%), Immigrants from Brazil (11.7%, a difference of 0.040%), Soviet Union (11.7%, a difference of 0.080%), Immigrants from Israel (11.7%, a difference of 0.14%), and Immigrants from Hungary (11.7%, a difference of 0.15%).
| Demographics | Rating | Rank | Poverty |
| Tlingit-Haida | 89.0 /100 | #119 | Excellent 11.7% |
| Immigrants | South Eastern Asia | 88.9 /100 | #120 | Excellent 11.7% |
| New Zealanders | 88.7 /100 | #121 | Excellent 11.7% |
| Puget Sound Salish | 88.7 /100 | #122 | Excellent 11.7% |
| Immigrants | Hungary | 88.6 /100 | #123 | Excellent 11.7% |
| Soviet Union | 88.4 /100 | #124 | Excellent 11.7% |
| Immigrants | Brazil | 88.2 /100 | #125 | Excellent 11.7% |
| Immigrants | Norway | 88.0 /100 | #126 | Excellent 11.7% |
| Immigrants | Argentina | 88.0 /100 | #127 | Excellent 11.7% |
| Immigrants | Israel | 87.4 /100 | #128 | Excellent 11.7% |
| South Africans | 87.0 /100 | #129 | Excellent 11.7% |
| Immigrants | Ukraine | 86.6 /100 | #130 | Excellent 11.8% |
| French | 86.1 /100 | #131 | Excellent 11.8% |
| Peruvians | 85.6 /100 | #132 | Excellent 11.8% |
| Immigrants | Western Europe | 85.2 /100 | #133 | Excellent 11.8% |
Demographics Similar to Immigrants from Syria by Poverty
In terms of poverty, the demographic groups most similar to Immigrants from Syria are Immigrants from Colombia (12.3%, a difference of 0.020%), South American (12.3%, a difference of 0.12%), Lebanese (12.3%, a difference of 0.25%), Celtic (12.3%, a difference of 0.26%), and Uruguayan (12.4%, a difference of 0.27%).
| Demographics | Rating | Rank | Poverty |
| Immigrants | Oceania | 54.6 /100 | #170 | Average 12.3% |
| Immigrants | Spain | 51.3 /100 | #171 | Average 12.3% |
| Immigrants | Portugal | 50.5 /100 | #172 | Average 12.3% |
| Celtics | 50.1 /100 | #173 | Average 12.3% |
| Lebanese | 50.0 /100 | #174 | Average 12.3% |
| South Americans | 48.7 /100 | #175 | Average 12.3% |
| Immigrants | Colombia | 47.7 /100 | #176 | Average 12.3% |
| Immigrants | Syria | 47.5 /100 | #177 | Average 12.3% |
| Uruguayans | 44.7 /100 | #178 | Average 12.4% |
| Immigrants | Morocco | 44.0 /100 | #179 | Average 12.4% |
| Mongolians | 43.6 /100 | #180 | Average 12.4% |
| Immigrants | Afghanistan | 42.1 /100 | #181 | Average 12.4% |
| Immigrants | Cameroon | 41.7 /100 | #182 | Average 12.4% |
| Immigrants | Iraq | 40.2 /100 | #183 | Average 12.4% |
| Kenyans | 38.8 /100 | #184 | Fair 12.5% |