Immigrants from North Macedonia vs Thai Female Poverty Among 18-24 Year Olds
COMPARE
Immigrants from North Macedonia
Thai
Female Poverty Among 18-24 Year Olds
Female Poverty Among 18-24 Year Olds Comparison
Immigrants from North Macedonia
Thais
17.6%
FEMALE POVERTY AMONG 18-24 YEAR OLDS
100.0/ 100
METRIC RATING
23rd/ 347
METRIC RANK
17.0%
FEMALE POVERTY AMONG 18-24 YEAR OLDS
100.0/ 100
METRIC RATING
11th/ 347
METRIC RANK
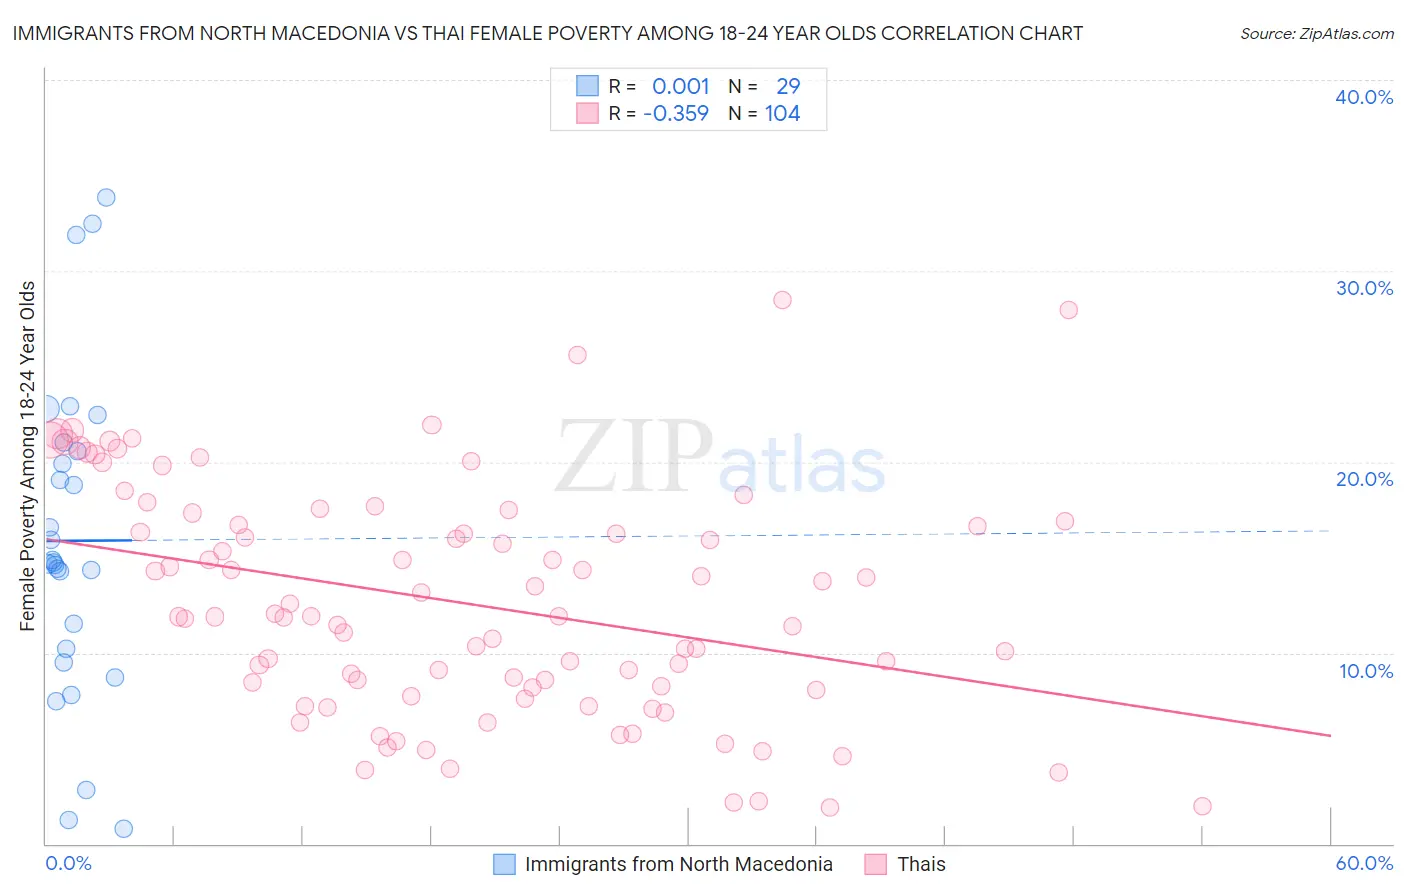
Immigrants from North Macedonia vs Thai Female Poverty Among 18-24 Year Olds Correlation Chart
The statistical analysis conducted on geographies consisting of 73,458,118 people shows no correlation between the proportion of Immigrants from North Macedonia and poverty level among females between the ages 18 and 24 in the United States with a correlation coefficient (R) of 0.001 and weighted average of 17.6%. Similarly, the statistical analysis conducted on geographies consisting of 460,499,856 people shows a mild negative correlation between the proportion of Thais and poverty level among females between the ages 18 and 24 in the United States with a correlation coefficient (R) of -0.359 and weighted average of 17.0%, a difference of 3.4%.
Female Poverty Among 18-24 Year Olds Correlation Summary
| Measurement | Immigrants from North Macedonia | Thai |
| Minimum | 0.76% | 1.9% |
| Maximum | 33.9% | 28.4% |
| Range | 33.1% | 26.5% |
| Mean | 15.9% | 12.6% |
| Median | 14.7% | 11.9% |
| Interquartile 25% (IQ1) | 9.9% | 8.1% |
| Interquartile 75% (IQ3) | 20.8% | 16.8% |
| Interquartile Range (IQR) | 10.9% | 8.7% |
| Standard Deviation (Sample) | 8.4% | 6.0% |
| Standard Deviation (Population) | 8.3% | 6.0% |
Demographics Similar to Immigrants from North Macedonia and Thais by Female Poverty Among 18-24 Year Olds
In terms of female poverty among 18-24 year olds, the demographic groups most similar to Immigrants from North Macedonia are Maltese (17.6%, a difference of 0.060%), Immigrants from South Central Asia (17.6%, a difference of 0.25%), Immigrants from Hong Kong (17.5%, a difference of 0.56%), Immigrants from Fiji (17.7%, a difference of 0.57%), and Immigrants from Venezuela (17.4%, a difference of 0.67%). Similarly, the demographic groups most similar to Thais are Immigrants from Pakistan (17.0%, a difference of 0.090%), Korean (16.9%, a difference of 0.27%), Immigrants from Peru (16.9%, a difference of 0.63%), Immigrants from Poland (17.1%, a difference of 0.75%), and Tongan (17.1%, a difference of 0.93%).
| Demographics | Rating | Rank | Female Poverty Among 18-24 Year Olds |
| Immigrants | Azores | 100.0 /100 | #7 | Exceptional 16.7% |
| Immigrants | Bolivia | 100.0 /100 | #8 | Exceptional 16.7% |
| Immigrants | Peru | 100.0 /100 | #9 | Exceptional 16.9% |
| Koreans | 100.0 /100 | #10 | Exceptional 16.9% |
| Thais | 100.0 /100 | #11 | Exceptional 17.0% |
| Immigrants | Pakistan | 100.0 /100 | #12 | Exceptional 17.0% |
| Immigrants | Poland | 100.0 /100 | #13 | Exceptional 17.1% |
| Tongans | 100.0 /100 | #14 | Exceptional 17.1% |
| Cubans | 100.0 /100 | #15 | Exceptional 17.2% |
| Peruvians | 100.0 /100 | #16 | Exceptional 17.2% |
| Immigrants | Taiwan | 100.0 /100 | #17 | Exceptional 17.3% |
| Immigrants | Colombia | 100.0 /100 | #18 | Exceptional 17.3% |
| Immigrants | Lithuania | 100.0 /100 | #19 | Exceptional 17.4% |
| Immigrants | Venezuela | 100.0 /100 | #20 | Exceptional 17.4% |
| Bolivians | 100.0 /100 | #21 | Exceptional 17.4% |
| Immigrants | Hong Kong | 100.0 /100 | #22 | Exceptional 17.5% |
| Immigrants | North Macedonia | 100.0 /100 | #23 | Exceptional 17.6% |
| Maltese | 100.0 /100 | #24 | Exceptional 17.6% |
| Immigrants | South Central Asia | 100.0 /100 | #25 | Exceptional 17.6% |
| Immigrants | Fiji | 100.0 /100 | #26 | Exceptional 17.7% |
| Colombians | 100.0 /100 | #27 | Exceptional 17.7% |