Immigrants from North Macedonia vs Immigrants from Belgium Single Mother Poverty
COMPARE
Immigrants from North Macedonia
Immigrants from Belgium
Single Mother Poverty
Single Mother Poverty Comparison
Immigrants from North Macedonia
Immigrants from Belgium
27.5%
SINGLE MOTHER POVERTY
99.2/ 100
METRIC RATING
78th/ 347
METRIC RANK
28.5%
SINGLE MOTHER POVERTY
88.5/ 100
METRIC RATING
138th/ 347
METRIC RANK
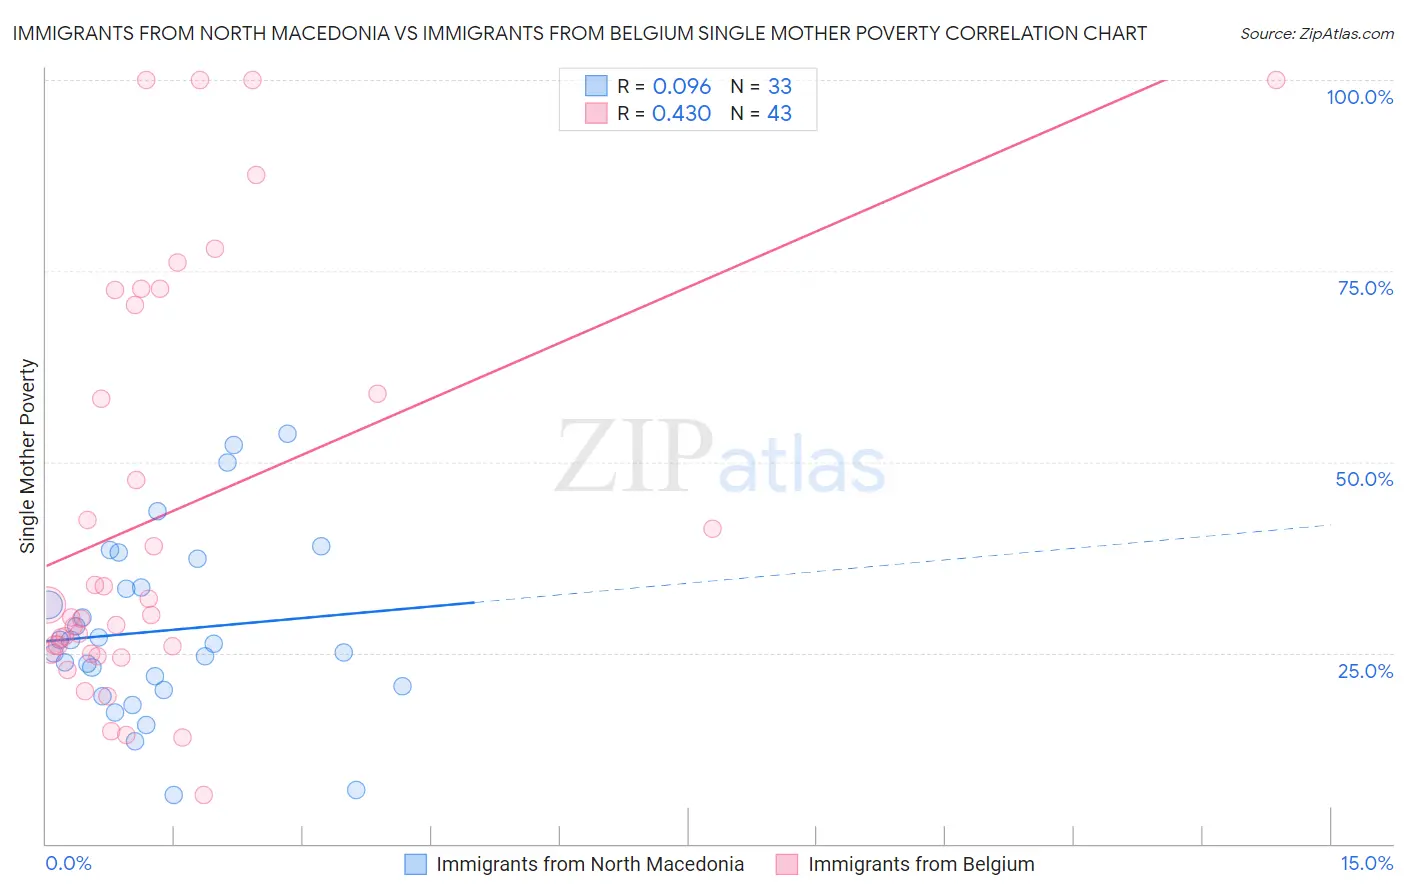
Immigrants from North Macedonia vs Immigrants from Belgium Single Mother Poverty Correlation Chart
The statistical analysis conducted on geographies consisting of 73,361,482 people shows a slight positive correlation between the proportion of Immigrants from North Macedonia and poverty level among single mothers in the United States with a correlation coefficient (R) of 0.096 and weighted average of 27.5%. Similarly, the statistical analysis conducted on geographies consisting of 144,308,237 people shows a moderate positive correlation between the proportion of Immigrants from Belgium and poverty level among single mothers in the United States with a correlation coefficient (R) of 0.430 and weighted average of 28.5%, a difference of 3.5%.
Single Mother Poverty Correlation Summary
| Measurement | Immigrants from North Macedonia | Immigrants from Belgium |
| Minimum | 6.4% | 6.3% |
| Maximum | 53.6% | 100.0% |
| Range | 47.2% | 93.7% |
| Mean | 27.9% | 43.3% |
| Median | 26.2% | 30.0% |
| Interquartile 25% (IQ1) | 20.3% | 25.0% |
| Interquartile 75% (IQ3) | 35.5% | 70.5% |
| Interquartile Range (IQR) | 15.1% | 45.5% |
| Standard Deviation (Sample) | 11.6% | 27.1% |
| Standard Deviation (Population) | 11.4% | 26.8% |
Similar Demographics by Single Mother Poverty
Demographics Similar to Immigrants from North Macedonia by Single Mother Poverty
In terms of single mother poverty, the demographic groups most similar to Immigrants from North Macedonia are Immigrants from Peru (27.5%, a difference of 0.010%), Peruvian (27.5%, a difference of 0.030%), Immigrants from Italy (27.5%, a difference of 0.030%), Taiwanese (27.5%, a difference of 0.040%), and Immigrants from Sweden (27.5%, a difference of 0.080%).
| Demographics | Rating | Rank | Single Mother Poverty |
| Macedonians | 99.4 /100 | #71 | Exceptional 27.4% |
| Immigrants | Russia | 99.4 /100 | #72 | Exceptional 27.4% |
| Sierra Leoneans | 99.3 /100 | #73 | Exceptional 27.4% |
| Immigrants | Europe | 99.3 /100 | #74 | Exceptional 27.4% |
| Immigrants | Sweden | 99.2 /100 | #75 | Exceptional 27.5% |
| Peruvians | 99.2 /100 | #76 | Exceptional 27.5% |
| Immigrants | Peru | 99.2 /100 | #77 | Exceptional 27.5% |
| Immigrants | North Macedonia | 99.2 /100 | #78 | Exceptional 27.5% |
| Immigrants | Italy | 99.1 /100 | #79 | Exceptional 27.5% |
| Taiwanese | 99.1 /100 | #80 | Exceptional 27.5% |
| Immigrants | Scotland | 98.9 /100 | #81 | Exceptional 27.6% |
| Immigrants | Cameroon | 98.8 /100 | #82 | Exceptional 27.6% |
| Greeks | 98.7 /100 | #83 | Exceptional 27.7% |
| Immigrants | Latvia | 98.7 /100 | #84 | Exceptional 27.7% |
| Mongolians | 98.7 /100 | #85 | Exceptional 27.7% |
Demographics Similar to Immigrants from Belgium by Single Mother Poverty
In terms of single mother poverty, the demographic groups most similar to Immigrants from Belgium are Native Hawaiian (28.4%, a difference of 0.050%), Immigrants from Canada (28.4%, a difference of 0.050%), Samoan (28.5%, a difference of 0.050%), Immigrants from Colombia (28.5%, a difference of 0.060%), and Immigrants from Southern Europe (28.4%, a difference of 0.090%).
| Demographics | Rating | Rank | Single Mother Poverty |
| Immigrants | Austria | 90.3 /100 | #131 | Exceptional 28.4% |
| Immigrants | Morocco | 89.5 /100 | #132 | Excellent 28.4% |
| Swedes | 89.4 /100 | #133 | Excellent 28.4% |
| Immigrants | Southern Europe | 89.2 /100 | #134 | Excellent 28.4% |
| Immigrants | Spain | 89.2 /100 | #135 | Excellent 28.4% |
| Native Hawaiians | 88.9 /100 | #136 | Excellent 28.4% |
| Immigrants | Canada | 88.9 /100 | #137 | Excellent 28.4% |
| Immigrants | Belgium | 88.5 /100 | #138 | Excellent 28.5% |
| Samoans | 88.1 /100 | #139 | Excellent 28.5% |
| Immigrants | Colombia | 88.0 /100 | #140 | Excellent 28.5% |
| Danes | 87.1 /100 | #141 | Excellent 28.5% |
| South Africans | 86.6 /100 | #142 | Excellent 28.5% |
| Immigrants | North America | 86.5 /100 | #143 | Excellent 28.5% |
| Luxembourgers | 86.4 /100 | #144 | Excellent 28.5% |
| Immigrants | South America | 86.1 /100 | #145 | Excellent 28.5% |