Immigrants from North America vs New Zealander Seniors Poverty Over the Age of 75
COMPARE
Immigrants from North America
New Zealander
Seniors Poverty Over the Age of 75
Seniors Poverty Over the Age of 75 Comparison
Immigrants from North America
New Zealanders
11.3%
SENIORS POVERTY OVER THE AGE OF 75
97.6/ 100
METRIC RATING
62nd/ 347
METRIC RANK
11.7%
SENIORS POVERTY OVER THE AGE OF 75
86.3/ 100
METRIC RATING
115th/ 347
METRIC RANK
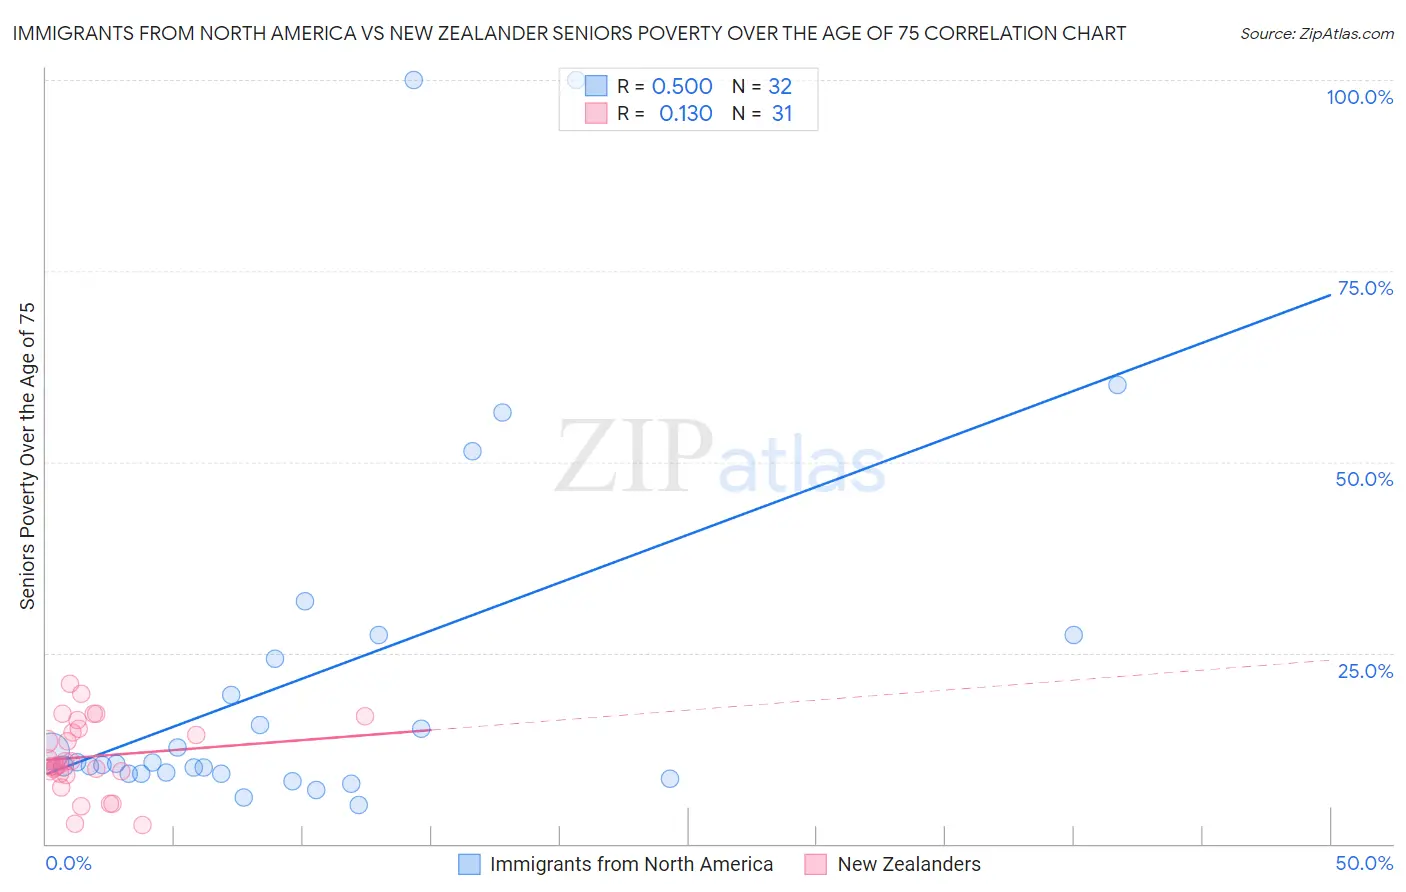
Immigrants from North America vs New Zealander Seniors Poverty Over the Age of 75 Correlation Chart
The statistical analysis conducted on geographies consisting of 455,027,803 people shows a substantial positive correlation between the proportion of Immigrants from North America and poverty level among seniors over the age of 75 in the United States with a correlation coefficient (R) of 0.500 and weighted average of 11.3%. Similarly, the statistical analysis conducted on geographies consisting of 106,459,325 people shows a poor positive correlation between the proportion of New Zealanders and poverty level among seniors over the age of 75 in the United States with a correlation coefficient (R) of 0.130 and weighted average of 11.7%, a difference of 4.1%.
Seniors Poverty Over the Age of 75 Correlation Summary
| Measurement | Immigrants from North America | New Zealander |
| Minimum | 5.0% | 2.5% |
| Maximum | 100.0% | 20.9% |
| Range | 95.0% | 18.4% |
| Mean | 22.3% | 11.4% |
| Median | 10.5% | 10.3% |
| Interquartile 25% (IQ1) | 9.2% | 9.1% |
| Interquartile 75% (IQ3) | 25.8% | 15.0% |
| Interquartile Range (IQR) | 16.6% | 5.9% |
| Standard Deviation (Sample) | 24.9% | 4.7% |
| Standard Deviation (Population) | 24.5% | 4.6% |
Similar Demographics by Seniors Poverty Over the Age of 75
Demographics Similar to Immigrants from North America by Seniors Poverty Over the Age of 75
In terms of seniors poverty over the age of 75, the demographic groups most similar to Immigrants from North America are Immigrants from Afghanistan (11.3%, a difference of 0.040%), Canadian (11.3%, a difference of 0.10%), Eastern European (11.3%, a difference of 0.13%), Immigrants from Northern Europe (11.3%, a difference of 0.18%), and Immigrants from Netherlands (11.2%, a difference of 0.25%).
| Demographics | Rating | Rank | Seniors Poverty Over the Age of 75 |
| Hungarians | 98.1 /100 | #55 | Exceptional 11.2% |
| Slavs | 98.1 /100 | #56 | Exceptional 11.2% |
| Immigrants | Canada | 97.9 /100 | #57 | Exceptional 11.2% |
| Yugoslavians | 97.9 /100 | #58 | Exceptional 11.2% |
| Immigrants | Netherlands | 97.8 /100 | #59 | Exceptional 11.2% |
| Eastern Europeans | 97.7 /100 | #60 | Exceptional 11.3% |
| Canadians | 97.7 /100 | #61 | Exceptional 11.3% |
| Immigrants | North America | 97.6 /100 | #62 | Exceptional 11.3% |
| Immigrants | Afghanistan | 97.5 /100 | #63 | Exceptional 11.3% |
| Immigrants | Northern Europe | 97.4 /100 | #64 | Exceptional 11.3% |
| Immigrants | Taiwan | 96.7 /100 | #65 | Exceptional 11.4% |
| Estonians | 96.7 /100 | #66 | Exceptional 11.4% |
| Bolivians | 96.5 /100 | #67 | Exceptional 11.4% |
| Immigrants | Austria | 96.5 /100 | #68 | Exceptional 11.4% |
| Ottawa | 96.5 /100 | #69 | Exceptional 11.4% |
Demographics Similar to New Zealanders by Seniors Poverty Over the Age of 75
In terms of seniors poverty over the age of 75, the demographic groups most similar to New Zealanders are Iraqi (11.7%, a difference of 0.0%), Ukrainian (11.7%, a difference of 0.10%), Immigrants from Czechoslovakia (11.7%, a difference of 0.11%), Icelander (11.7%, a difference of 0.11%), and Immigrants from Zimbabwe (11.7%, a difference of 0.14%).
| Demographics | Rating | Rank | Seniors Poverty Over the Age of 75 |
| Turks | 89.4 /100 | #108 | Excellent 11.7% |
| South Africans | 89.3 /100 | #109 | Excellent 11.7% |
| Immigrants | Jordan | 88.7 /100 | #110 | Excellent 11.7% |
| Burmese | 88.7 /100 | #111 | Excellent 11.7% |
| Immigrants | Bolivia | 88.4 /100 | #112 | Excellent 11.7% |
| Immigrants | Czechoslovakia | 87.0 /100 | #113 | Excellent 11.7% |
| Ukrainians | 86.9 /100 | #114 | Excellent 11.7% |
| New Zealanders | 86.3 /100 | #115 | Excellent 11.7% |
| Iraqis | 86.3 /100 | #116 | Excellent 11.7% |
| Icelanders | 85.7 /100 | #117 | Excellent 11.7% |
| Immigrants | Zimbabwe | 85.5 /100 | #118 | Excellent 11.7% |
| Immigrants | Uganda | 84.8 /100 | #119 | Excellent 11.8% |
| Immigrants | Nepal | 84.5 /100 | #120 | Excellent 11.8% |
| Malaysians | 84.1 /100 | #121 | Excellent 11.8% |
| Pakistanis | 84.0 /100 | #122 | Excellent 11.8% |