Immigrants from North America vs Immigrants from Kazakhstan Child Poverty Among Girls Under 16
COMPARE
Immigrants from North America
Immigrants from Kazakhstan
Child Poverty Among Girls Under 16
Child Poverty Among Girls Under 16 Comparison
Immigrants from North America
Immigrants from Kazakhstan
14.9%
CHILD POVERTY AMONG GIRLS UNDER 16
96.6/ 100
METRIC RATING
93rd/ 347
METRIC RANK
15.1%
CHILD POVERTY AMONG GIRLS UNDER 16
94.3/ 100
METRIC RATING
112th/ 347
METRIC RANK
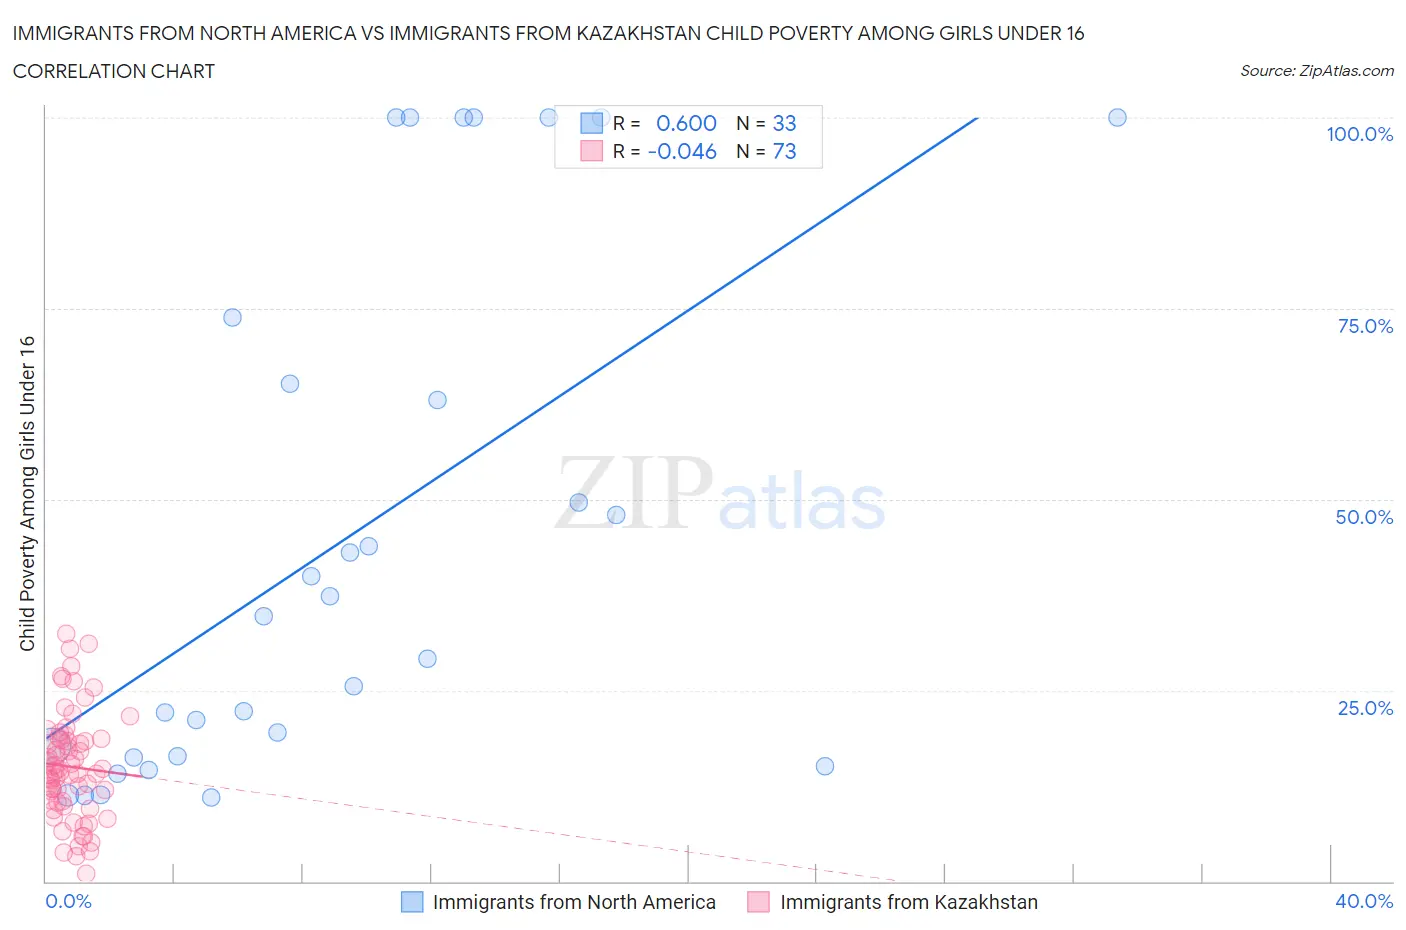
Immigrants from North America vs Immigrants from Kazakhstan Child Poverty Among Girls Under 16 Correlation Chart
The statistical analysis conducted on geographies consisting of 450,018,765 people shows a substantial positive correlation between the proportion of Immigrants from North America and poverty level among girls under the age of 16 in the United States with a correlation coefficient (R) of 0.600 and weighted average of 14.9%. Similarly, the statistical analysis conducted on geographies consisting of 123,526,564 people shows no correlation between the proportion of Immigrants from Kazakhstan and poverty level among girls under the age of 16 in the United States with a correlation coefficient (R) of -0.046 and weighted average of 15.1%, a difference of 1.7%.
Child Poverty Among Girls Under 16 Correlation Summary
| Measurement | Immigrants from North America | Immigrants from Kazakhstan |
| Minimum | 11.0% | 0.93% |
| Maximum | 100.0% | 32.4% |
| Range | 89.0% | 31.5% |
| Mean | 44.8% | 15.0% |
| Median | 34.8% | 14.5% |
| Interquartile 25% (IQ1) | 16.3% | 10.4% |
| Interquartile 75% (IQ3) | 69.5% | 18.6% |
| Interquartile Range (IQR) | 53.2% | 8.2% |
| Standard Deviation (Sample) | 33.4% | 6.9% |
| Standard Deviation (Population) | 32.8% | 6.8% |
Demographics Similar to Immigrants from North America and Immigrants from Kazakhstan by Child Poverty Among Girls Under 16
In terms of child poverty among girls under 16, the demographic groups most similar to Immigrants from North America are Austrian (14.9%, a difference of 0.070%), Immigrants from Switzerland (14.9%, a difference of 0.28%), German (14.9%, a difference of 0.30%), Immigrants from France (14.9%, a difference of 0.34%), and Immigrants from Latvia (14.9%, a difference of 0.43%). Similarly, the demographic groups most similar to Immigrants from Kazakhstan are Palestinian (15.1%, a difference of 0.14%), Immigrants from Croatia (15.1%, a difference of 0.19%), Serbian (15.1%, a difference of 0.30%), Immigrants from Brazil (15.1%, a difference of 0.39%), and Immigrants from Ukraine (15.1%, a difference of 0.46%).
| Demographics | Rating | Rank | Child Poverty Among Girls Under 16 |
| Austrians | 96.7 /100 | #92 | Exceptional 14.9% |
| Immigrants | North America | 96.6 /100 | #93 | Exceptional 14.9% |
| Immigrants | Switzerland | 96.3 /100 | #94 | Exceptional 14.9% |
| Germans | 96.3 /100 | #95 | Exceptional 14.9% |
| Immigrants | France | 96.2 /100 | #96 | Exceptional 14.9% |
| Immigrants | Latvia | 96.1 /100 | #97 | Exceptional 14.9% |
| Basques | 95.9 /100 | #98 | Exceptional 15.0% |
| Immigrants | Egypt | 95.7 /100 | #99 | Exceptional 15.0% |
| Paraguayans | 95.7 /100 | #100 | Exceptional 15.0% |
| Immigrants | South Africa | 95.6 /100 | #101 | Exceptional 15.0% |
| Immigrants | Malaysia | 95.6 /100 | #102 | Exceptional 15.0% |
| British | 95.6 /100 | #103 | Exceptional 15.0% |
| Romanians | 95.3 /100 | #104 | Exceptional 15.0% |
| Immigrants | England | 95.1 /100 | #105 | Exceptional 15.1% |
| Chileans | 95.1 /100 | #106 | Exceptional 15.1% |
| Immigrants | Ukraine | 95.0 /100 | #107 | Exceptional 15.1% |
| Immigrants | Brazil | 94.9 /100 | #108 | Exceptional 15.1% |
| Serbians | 94.8 /100 | #109 | Exceptional 15.1% |
| Immigrants | Croatia | 94.6 /100 | #110 | Exceptional 15.1% |
| Palestinians | 94.5 /100 | #111 | Exceptional 15.1% |
| Immigrants | Kazakhstan | 94.3 /100 | #112 | Exceptional 15.1% |