Immigrants from Nicaragua vs Immigrants from South Eastern Asia Single Mother Poverty
COMPARE
Immigrants from Nicaragua
Immigrants from South Eastern Asia
Single Mother Poverty
Single Mother Poverty Comparison
Immigrants from Nicaragua
Immigrants from South Eastern Asia
30.3%
SINGLE MOTHER POVERTY
3.5/ 100
METRIC RATING
234th/ 347
METRIC RANK
27.1%
SINGLE MOTHER POVERTY
99.7/ 100
METRIC RATING
52nd/ 347
METRIC RANK
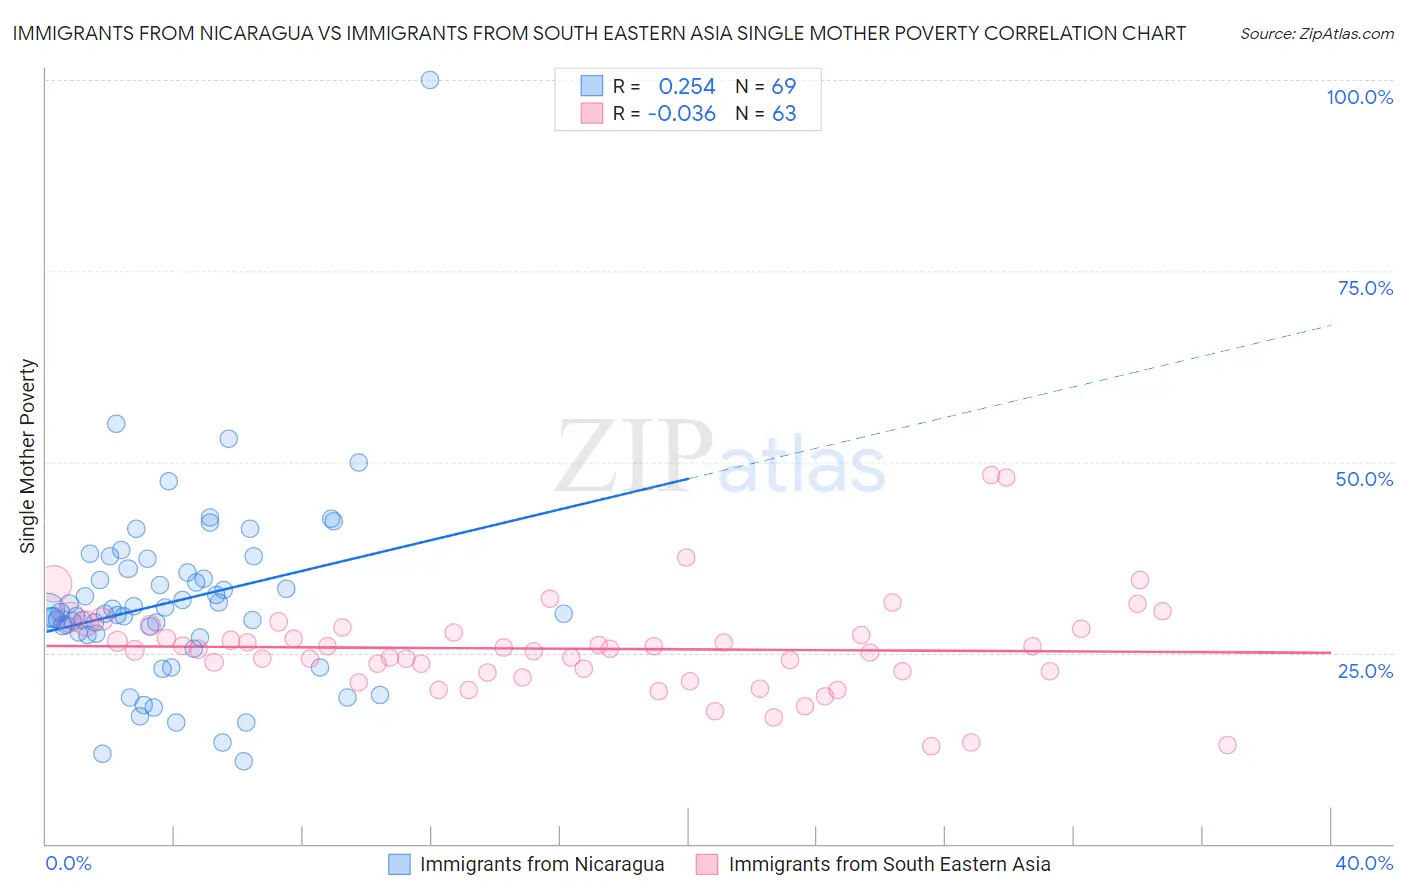
Immigrants from Nicaragua vs Immigrants from South Eastern Asia Single Mother Poverty Correlation Chart
The statistical analysis conducted on geographies consisting of 234,135,919 people shows a weak positive correlation between the proportion of Immigrants from Nicaragua and poverty level among single mothers in the United States with a correlation coefficient (R) of 0.254 and weighted average of 30.3%. Similarly, the statistical analysis conducted on geographies consisting of 494,549,993 people shows no correlation between the proportion of Immigrants from South Eastern Asia and poverty level among single mothers in the United States with a correlation coefficient (R) of -0.036 and weighted average of 27.1%, a difference of 11.8%.
Single Mother Poverty Correlation Summary
| Measurement | Immigrants from Nicaragua | Immigrants from South Eastern Asia |
| Minimum | 10.8% | 12.7% |
| Maximum | 100.0% | 48.3% |
| Range | 89.2% | 35.5% |
| Mean | 31.7% | 25.5% |
| Median | 30.2% | 25.5% |
| Interquartile 25% (IQ1) | 27.4% | 22.4% |
| Interquartile 75% (IQ3) | 35.7% | 28.2% |
| Interquartile Range (IQR) | 8.3% | 5.7% |
| Standard Deviation (Sample) | 12.3% | 6.4% |
| Standard Deviation (Population) | 12.2% | 6.3% |
Similar Demographics by Single Mother Poverty
Demographics Similar to Immigrants from Nicaragua by Single Mother Poverty
In terms of single mother poverty, the demographic groups most similar to Immigrants from Nicaragua are Immigrants from Middle Africa (30.3%, a difference of 0.0%), Immigrants from Grenada (30.3%, a difference of 0.030%), Welsh (30.4%, a difference of 0.10%), Immigrants from St. Vincent and the Grenadines (30.4%, a difference of 0.14%), and Alaskan Athabascan (30.3%, a difference of 0.22%).
| Demographics | Rating | Rank | Single Mother Poverty |
| Immigrants | Liberia | 5.9 /100 | #227 | Tragic 30.1% |
| Spaniards | 5.4 /100 | #228 | Tragic 30.2% |
| Immigrants | Barbados | 5.0 /100 | #229 | Tragic 30.2% |
| English | 4.8 /100 | #230 | Tragic 30.2% |
| Dutch | 4.3 /100 | #231 | Tragic 30.2% |
| Alaskan Athabascans | 4.1 /100 | #232 | Tragic 30.3% |
| Immigrants | Middle Africa | 3.5 /100 | #233 | Tragic 30.3% |
| Immigrants | Nicaragua | 3.5 /100 | #234 | Tragic 30.3% |
| Immigrants | Grenada | 3.4 /100 | #235 | Tragic 30.3% |
| Welsh | 3.2 /100 | #236 | Tragic 30.4% |
| Immigrants | St. Vincent and the Grenadines | 3.1 /100 | #237 | Tragic 30.4% |
| Slovaks | 2.8 /100 | #238 | Tragic 30.4% |
| Immigrants | Portugal | 2.1 /100 | #239 | Tragic 30.5% |
| Salvadorans | 1.8 /100 | #240 | Tragic 30.6% |
| Immigrants | Laos | 1.8 /100 | #241 | Tragic 30.6% |
Demographics Similar to Immigrants from South Eastern Asia by Single Mother Poverty
In terms of single mother poverty, the demographic groups most similar to Immigrants from South Eastern Asia are Immigrants from Argentina (27.1%, a difference of 0.040%), Immigrants from Jordan (27.1%, a difference of 0.040%), Immigrants from Bulgaria (27.1%, a difference of 0.070%), Immigrants from Egypt (27.1%, a difference of 0.10%), and Immigrants from Romania (27.2%, a difference of 0.15%).
| Demographics | Rating | Rank | Single Mother Poverty |
| Latvians | 99.9 /100 | #45 | Exceptional 26.9% |
| Immigrants | Serbia | 99.9 /100 | #46 | Exceptional 26.9% |
| Egyptians | 99.8 /100 | #47 | Exceptional 26.9% |
| Immigrants | Poland | 99.8 /100 | #48 | Exceptional 26.9% |
| Cambodians | 99.8 /100 | #49 | Exceptional 27.0% |
| Laotians | 99.8 /100 | #50 | Exceptional 27.0% |
| Immigrants | Argentina | 99.7 /100 | #51 | Exceptional 27.1% |
| Immigrants | South Eastern Asia | 99.7 /100 | #52 | Exceptional 27.1% |
| Immigrants | Jordan | 99.7 /100 | #53 | Exceptional 27.1% |
| Immigrants | Bulgaria | 99.7 /100 | #54 | Exceptional 27.1% |
| Immigrants | Egypt | 99.7 /100 | #55 | Exceptional 27.1% |
| Immigrants | Romania | 99.7 /100 | #56 | Exceptional 27.2% |
| Palestinians | 99.7 /100 | #57 | Exceptional 27.2% |
| Argentineans | 99.6 /100 | #58 | Exceptional 27.2% |
| Paraguayans | 99.6 /100 | #59 | Exceptional 27.2% |