Immigrants from Netherlands vs Albanian Family Poverty
COMPARE
Immigrants from Netherlands
Albanian
Family Poverty
Family Poverty Comparison
Immigrants from Netherlands
Albanians
7.7%
FAMILY POVERTY
98.6/ 100
METRIC RATING
61st/ 347
METRIC RANK
8.5%
FAMILY POVERTY
83.3/ 100
METRIC RATING
144th/ 347
METRIC RANK
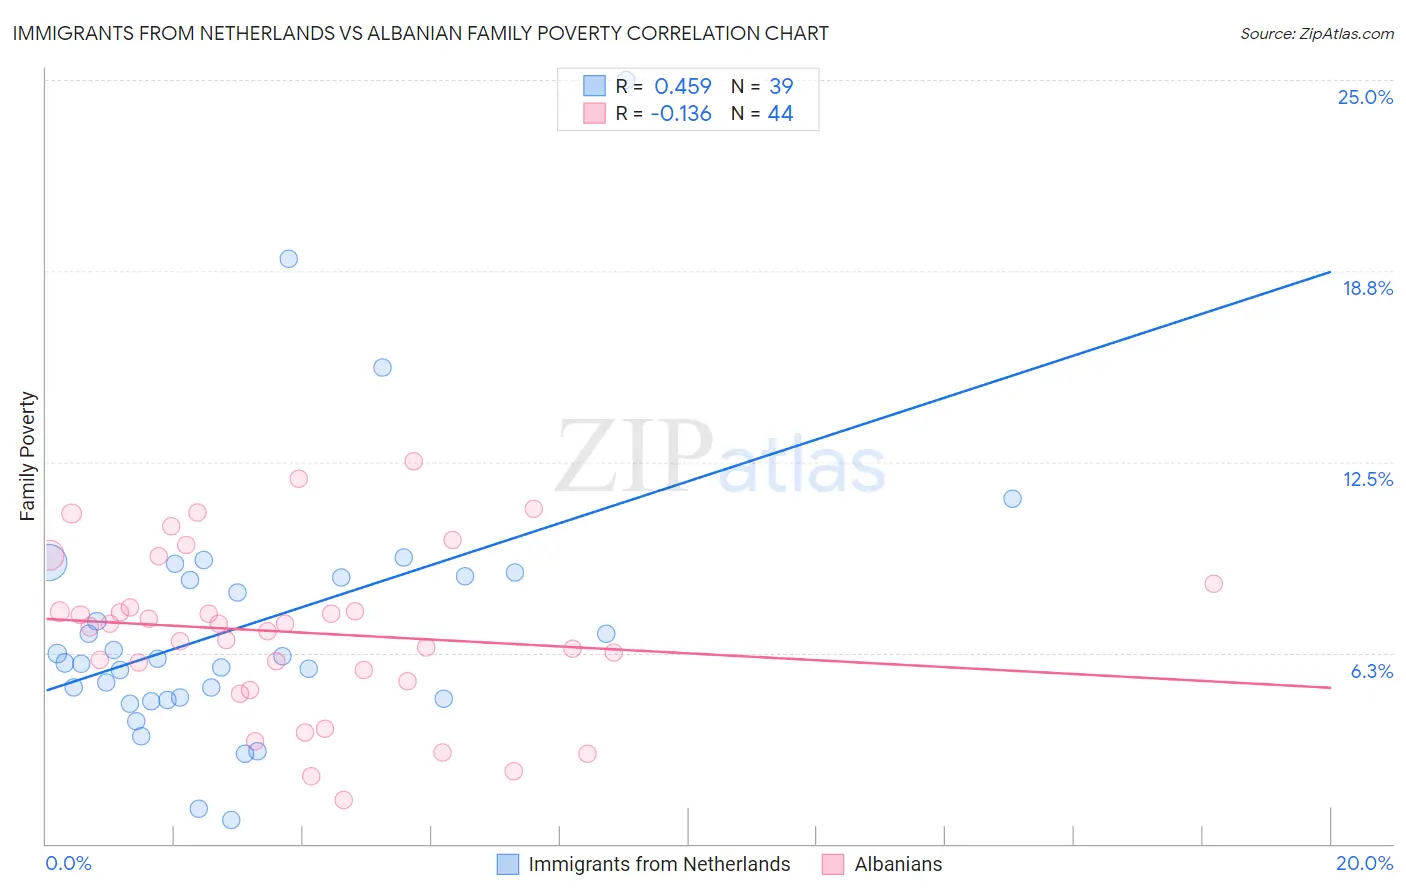
Immigrants from Netherlands vs Albanian Family Poverty Correlation Chart
The statistical analysis conducted on geographies consisting of 237,430,105 people shows a moderate positive correlation between the proportion of Immigrants from Netherlands and poverty level among families in the United States with a correlation coefficient (R) of 0.459 and weighted average of 7.7%. Similarly, the statistical analysis conducted on geographies consisting of 192,873,103 people shows a poor negative correlation between the proportion of Albanians and poverty level among families in the United States with a correlation coefficient (R) of -0.136 and weighted average of 8.5%, a difference of 10.2%.
Family Poverty Correlation Summary
| Measurement | Immigrants from Netherlands | Albanian |
| Minimum | 0.78% | 1.4% |
| Maximum | 25.0% | 12.5% |
| Range | 24.2% | 11.1% |
| Mean | 7.2% | 6.9% |
| Median | 6.1% | 7.1% |
| Interquartile 25% (IQ1) | 4.7% | 5.5% |
| Interquartile 75% (IQ3) | 8.7% | 8.1% |
| Interquartile Range (IQR) | 4.0% | 2.6% |
| Standard Deviation (Sample) | 4.5% | 2.7% |
| Standard Deviation (Population) | 4.4% | 2.6% |
Similar Demographics by Family Poverty
Demographics Similar to Immigrants from Netherlands by Family Poverty
In terms of family poverty, the demographic groups most similar to Immigrants from Netherlands are Immigrants from Greece (7.7%, a difference of 0.18%), European (7.7%, a difference of 0.19%), Macedonian (7.8%, a difference of 0.19%), Finnish (7.7%, a difference of 0.20%), and Asian (7.7%, a difference of 0.23%).
| Demographics | Rating | Rank | Family Poverty |
| Immigrants | Sweden | 98.8 /100 | #54 | Exceptional 7.7% |
| Immigrants | Eastern Asia | 98.7 /100 | #55 | Exceptional 7.7% |
| Immigrants | Serbia | 98.7 /100 | #56 | Exceptional 7.7% |
| Asians | 98.7 /100 | #57 | Exceptional 7.7% |
| Finns | 98.7 /100 | #58 | Exceptional 7.7% |
| Europeans | 98.7 /100 | #59 | Exceptional 7.7% |
| Immigrants | Greece | 98.7 /100 | #60 | Exceptional 7.7% |
| Immigrants | Netherlands | 98.6 /100 | #61 | Exceptional 7.7% |
| Macedonians | 98.6 /100 | #62 | Exceptional 7.8% |
| Zimbabweans | 98.4 /100 | #63 | Exceptional 7.8% |
| Koreans | 98.3 /100 | #64 | Exceptional 7.8% |
| Immigrants | Bulgaria | 98.3 /100 | #65 | Exceptional 7.8% |
| Dutch | 98.3 /100 | #66 | Exceptional 7.8% |
| Northern Europeans | 98.3 /100 | #67 | Exceptional 7.8% |
| Australians | 98.2 /100 | #68 | Exceptional 7.8% |
Demographics Similar to Albanians by Family Poverty
In terms of family poverty, the demographic groups most similar to Albanians are Immigrants from Germany (8.5%, a difference of 0.020%), Immigrants from South Eastern Asia (8.5%, a difference of 0.020%), Immigrants from Belarus (8.5%, a difference of 0.030%), Yugoslavian (8.5%, a difference of 0.050%), and Immigrants from Jordan (8.5%, a difference of 0.060%).
| Demographics | Rating | Rank | Family Poverty |
| Immigrants | Southern Europe | 86.0 /100 | #137 | Excellent 8.5% |
| Armenians | 84.6 /100 | #138 | Excellent 8.5% |
| Immigrants | Nepal | 84.2 /100 | #139 | Excellent 8.5% |
| Immigrants | Kazakhstan | 84.1 /100 | #140 | Excellent 8.5% |
| Immigrants | Ukraine | 83.9 /100 | #141 | Excellent 8.5% |
| Yugoslavians | 83.5 /100 | #142 | Excellent 8.5% |
| Immigrants | Germany | 83.3 /100 | #143 | Excellent 8.5% |
| Albanians | 83.3 /100 | #144 | Excellent 8.5% |
| Immigrants | South Eastern Asia | 83.2 /100 | #145 | Excellent 8.5% |
| Immigrants | Belarus | 83.2 /100 | #146 | Excellent 8.5% |
| Immigrants | Jordan | 83.0 /100 | #147 | Excellent 8.5% |
| Scotch-Irish | 82.2 /100 | #148 | Excellent 8.6% |
| Mongolians | 80.4 /100 | #149 | Excellent 8.6% |
| Syrians | 80.3 /100 | #150 | Excellent 8.6% |
| Brazilians | 80.1 /100 | #151 | Excellent 8.6% |