Immigrants from Nepal vs Central American Child Poverty Under the Age of 16
COMPARE
Immigrants from Nepal
Central American
Child Poverty Under the Age of 16
Child Poverty Under the Age of 16 Comparison
Immigrants from Nepal
Central Americans
15.7%
CHILD POVERTY UNDER THE AGE OF 16
72.9/ 100
METRIC RATING
157th/ 347
METRIC RANK
20.0%
CHILD POVERTY UNDER THE AGE OF 16
0.0/ 100
METRIC RATING
281st/ 347
METRIC RANK
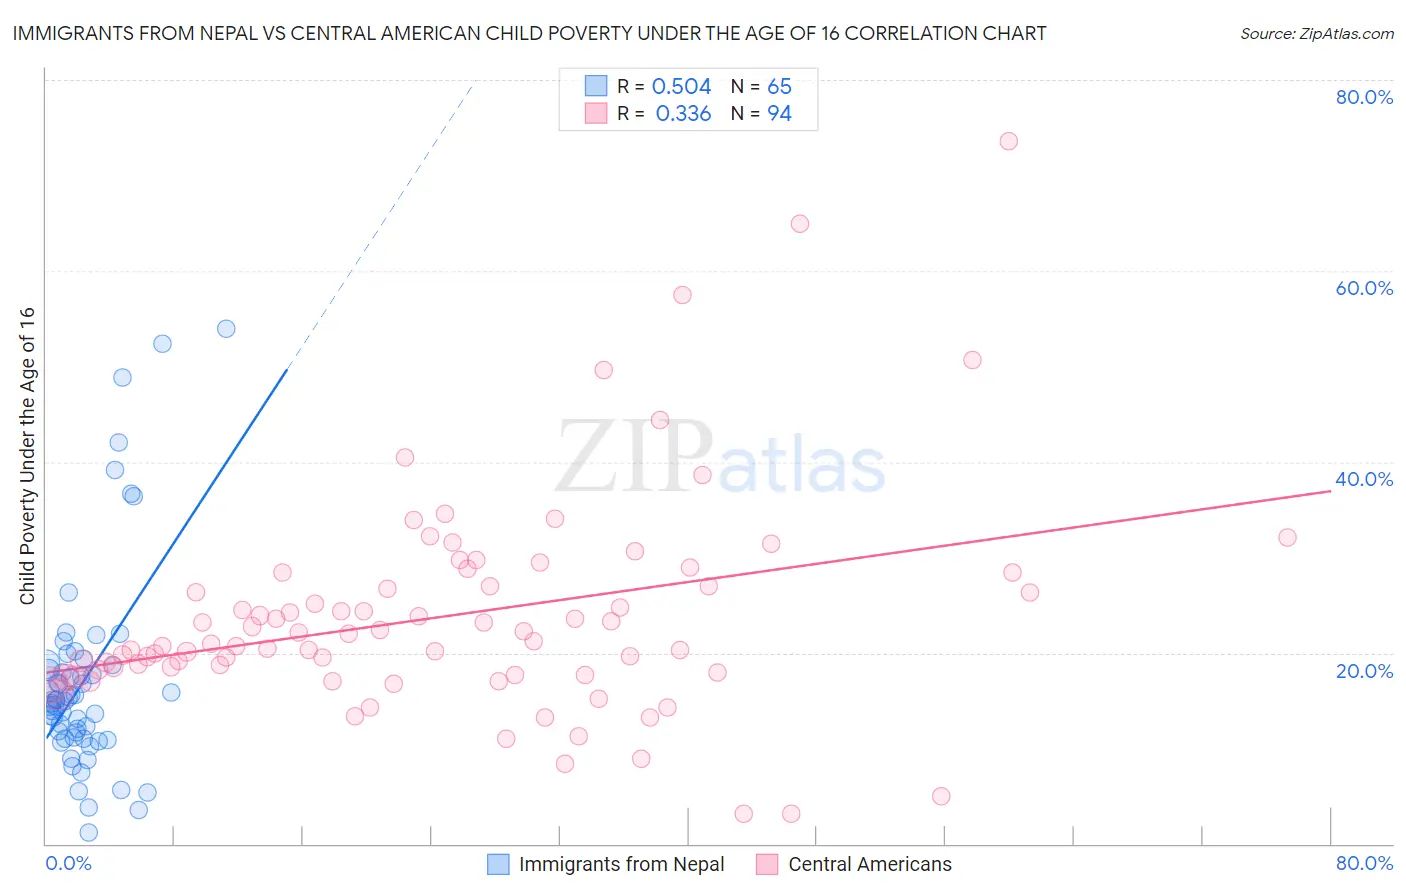
Immigrants from Nepal vs Central American Child Poverty Under the Age of 16 Correlation Chart
The statistical analysis conducted on geographies consisting of 186,101,389 people shows a substantial positive correlation between the proportion of Immigrants from Nepal and poverty level among children under the age of 16 in the United States with a correlation coefficient (R) of 0.504 and weighted average of 15.7%. Similarly, the statistical analysis conducted on geographies consisting of 498,716,679 people shows a mild positive correlation between the proportion of Central Americans and poverty level among children under the age of 16 in the United States with a correlation coefficient (R) of 0.336 and weighted average of 20.0%, a difference of 27.5%.
Child Poverty Under the Age of 16 Correlation Summary
| Measurement | Immigrants from Nepal | Central American |
| Minimum | 1.2% | 3.1% |
| Maximum | 53.9% | 73.5% |
| Range | 52.7% | 70.4% |
| Mean | 17.2% | 23.8% |
| Median | 15.0% | 21.1% |
| Interquartile 25% (IQ1) | 11.1% | 17.9% |
| Interquartile 75% (IQ3) | 18.7% | 27.0% |
| Interquartile Range (IQR) | 7.7% | 9.1% |
| Standard Deviation (Sample) | 10.8% | 11.4% |
| Standard Deviation (Population) | 10.8% | 11.3% |
Similar Demographics by Child Poverty Under the Age of 16
Demographics Similar to Immigrants from Nepal by Child Poverty Under the Age of 16
In terms of child poverty under the age of 16, the demographic groups most similar to Immigrants from Nepal are Immigrants from Chile (15.7%, a difference of 0.020%), Immigrants from Fiji (15.8%, a difference of 0.27%), Immigrants from Venezuela (15.7%, a difference of 0.32%), Immigrants from Albania (15.8%, a difference of 0.34%), and Syrian (15.6%, a difference of 0.52%).
| Demographics | Rating | Rank | Child Poverty Under the Age of 16 |
| Immigrants | Jordan | 78.5 /100 | #150 | Good 15.6% |
| French | 78.5 /100 | #151 | Good 15.6% |
| French Canadians | 78.2 /100 | #152 | Good 15.6% |
| Venezuelans | 77.4 /100 | #153 | Good 15.6% |
| Samoans | 77.3 /100 | #154 | Good 15.6% |
| Syrians | 76.1 /100 | #155 | Good 15.6% |
| Immigrants | Venezuela | 74.9 /100 | #156 | Good 15.7% |
| Immigrants | Nepal | 72.9 /100 | #157 | Good 15.7% |
| Immigrants | Chile | 72.8 /100 | #158 | Good 15.7% |
| Immigrants | Fiji | 71.1 /100 | #159 | Good 15.8% |
| Immigrants | Albania | 70.7 /100 | #160 | Good 15.8% |
| Immigrants | Northern Africa | 68.1 /100 | #161 | Good 15.8% |
| Colombians | 67.6 /100 | #162 | Good 15.8% |
| Yugoslavians | 67.6 /100 | #163 | Good 15.8% |
| Immigrants | Germany | 67.3 /100 | #164 | Good 15.8% |
Demographics Similar to Central Americans by Child Poverty Under the Age of 16
In terms of child poverty under the age of 16, the demographic groups most similar to Central Americans are Barbadian (20.0%, a difference of 0.030%), Immigrants from Zaire (20.1%, a difference of 0.26%), West Indian (20.1%, a difference of 0.40%), Immigrants from St. Vincent and the Grenadines (20.1%, a difference of 0.47%), and Immigrants from West Indies (20.2%, a difference of 0.61%).
| Demographics | Rating | Rank | Child Poverty Under the Age of 16 |
| Immigrants | Cabo Verde | 0.1 /100 | #274 | Tragic 19.9% |
| Immigrants | Barbados | 0.1 /100 | #275 | Tragic 19.9% |
| Belizeans | 0.1 /100 | #276 | Tragic 19.9% |
| Iroquois | 0.1 /100 | #277 | Tragic 19.9% |
| Bangladeshis | 0.0 /100 | #278 | Tragic 19.9% |
| Sub-Saharan Africans | 0.0 /100 | #279 | Tragic 19.9% |
| Comanche | 0.0 /100 | #280 | Tragic 19.9% |
| Central Americans | 0.0 /100 | #281 | Tragic 20.0% |
| Barbadians | 0.0 /100 | #282 | Tragic 20.0% |
| Immigrants | Zaire | 0.0 /100 | #283 | Tragic 20.1% |
| West Indians | 0.0 /100 | #284 | Tragic 20.1% |
| Immigrants | St. Vincent and the Grenadines | 0.0 /100 | #285 | Tragic 20.1% |
| Immigrants | West Indies | 0.0 /100 | #286 | Tragic 20.2% |
| Blackfeet | 0.0 /100 | #287 | Tragic 20.2% |
| Immigrants | Belize | 0.0 /100 | #288 | Tragic 20.3% |