Immigrants from Middle Africa vs Immigrants from El Salvador Seniors Poverty Over the Age of 65
COMPARE
Immigrants from Middle Africa
Immigrants from El Salvador
Seniors Poverty Over the Age of 65
Seniors Poverty Over the Age of 65 Comparison
Immigrants from Middle Africa
Immigrants from El Salvador
11.1%
SENIORS POVERTY OVER THE AGE OF 65
37.4/ 100
METRIC RATING
187th/ 347
METRIC RANK
13.1%
SENIORS POVERTY OVER THE AGE OF 65
0.0/ 100
METRIC RATING
281st/ 347
METRIC RANK
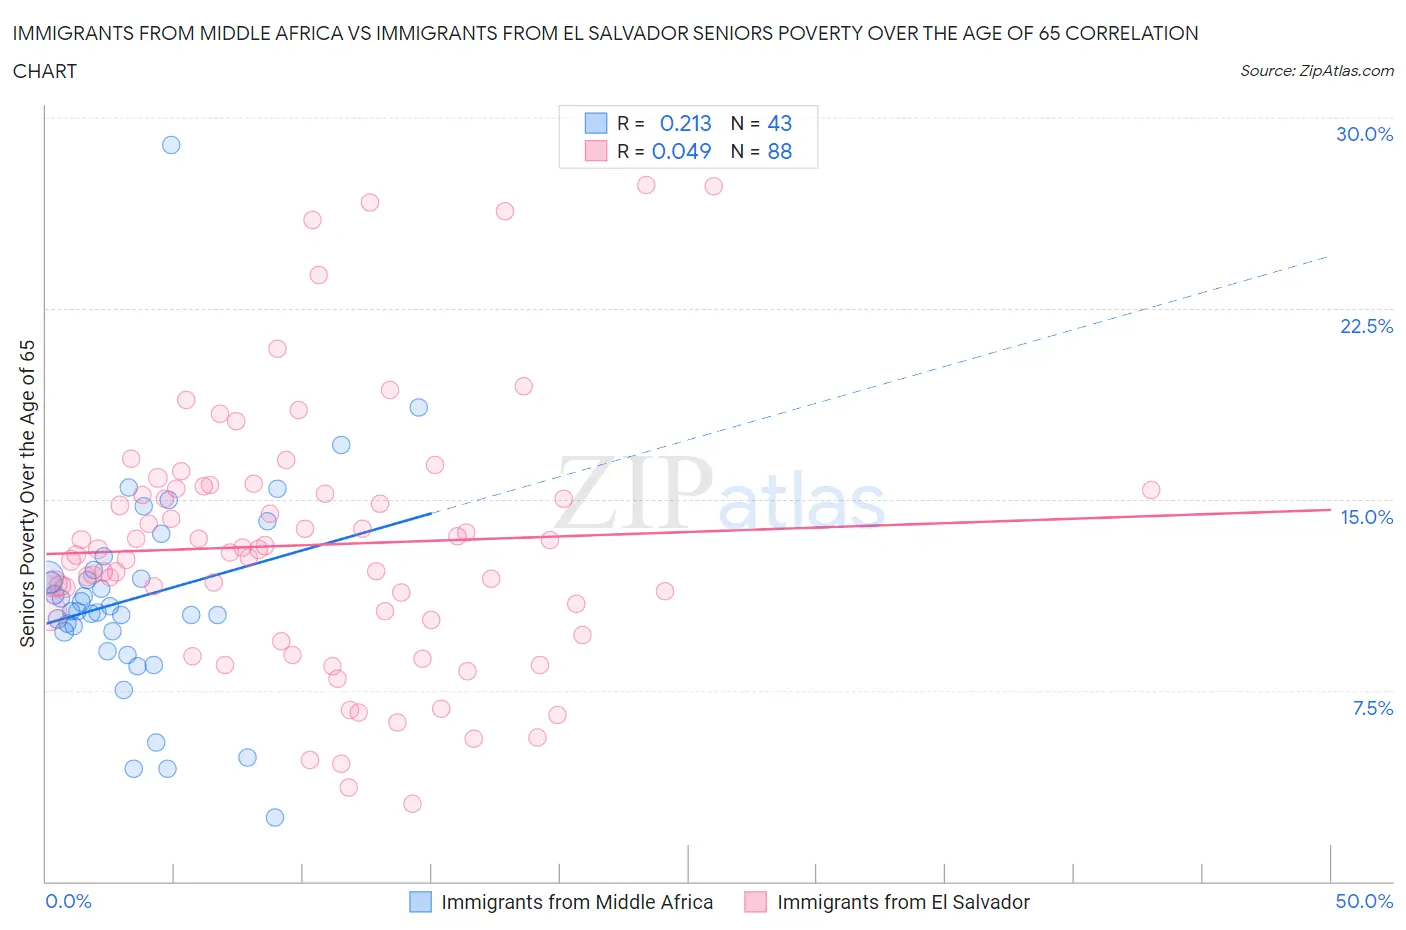
Immigrants from Middle Africa vs Immigrants from El Salvador Seniors Poverty Over the Age of 65 Correlation Chart
The statistical analysis conducted on geographies consisting of 202,261,140 people shows a weak positive correlation between the proportion of Immigrants from Middle Africa and poverty level among seniors over the age of 65 in the United States with a correlation coefficient (R) of 0.213 and weighted average of 11.1%. Similarly, the statistical analysis conducted on geographies consisting of 356,923,596 people shows no correlation between the proportion of Immigrants from El Salvador and poverty level among seniors over the age of 65 in the United States with a correlation coefficient (R) of 0.049 and weighted average of 13.1%, a difference of 18.7%.
Seniors Poverty Over the Age of 65 Correlation Summary
| Measurement | Immigrants from Middle Africa | Immigrants from El Salvador |
| Minimum | 2.5% | 3.0% |
| Maximum | 28.9% | 27.3% |
| Range | 26.4% | 24.3% |
| Mean | 11.2% | 13.2% |
| Median | 10.6% | 13.0% |
| Interquartile 25% (IQ1) | 9.8% | 10.4% |
| Interquartile 75% (IQ3) | 12.2% | 15.4% |
| Interquartile Range (IQR) | 2.5% | 5.0% |
| Standard Deviation (Sample) | 4.3% | 5.1% |
| Standard Deviation (Population) | 4.3% | 5.1% |
Similar Demographics by Seniors Poverty Over the Age of 65
Demographics Similar to Immigrants from Middle Africa by Seniors Poverty Over the Age of 65
In terms of seniors poverty over the age of 65, the demographic groups most similar to Immigrants from Middle Africa are Immigrants from Eastern Asia (11.1%, a difference of 0.010%), Immigrants from Lebanon (11.1%, a difference of 0.070%), Immigrants from Hong Kong (11.1%, a difference of 0.10%), Immigrants from Laos (11.1%, a difference of 0.16%), and Indian (Asian) (11.1%, a difference of 0.31%).
| Demographics | Rating | Rank | Seniors Poverty Over the Age of 65 |
| Immigrants | Thailand | 43.5 /100 | #180 | Average 11.0% |
| Immigrants | Eastern Africa | 43.4 /100 | #181 | Average 11.0% |
| Immigrants | Fiji | 42.0 /100 | #182 | Average 11.0% |
| Immigrants | Kazakhstan | 41.0 /100 | #183 | Average 11.0% |
| Immigrants | France | 40.9 /100 | #184 | Average 11.0% |
| Immigrants | Lebanon | 38.2 /100 | #185 | Fair 11.1% |
| Immigrants | Eastern Asia | 37.5 /100 | #186 | Fair 11.1% |
| Immigrants | Middle Africa | 37.4 /100 | #187 | Fair 11.1% |
| Immigrants | Hong Kong | 36.3 /100 | #188 | Fair 11.1% |
| Immigrants | Laos | 35.7 /100 | #189 | Fair 11.1% |
| Indians (Asian) | 34.2 /100 | #190 | Fair 11.1% |
| Immigrants | Uganda | 32.2 /100 | #191 | Fair 11.1% |
| Immigrants | Southern Europe | 30.1 /100 | #192 | Fair 11.1% |
| Taiwanese | 29.2 /100 | #193 | Fair 11.2% |
| Chileans | 27.8 /100 | #194 | Fair 11.2% |
Demographics Similar to Immigrants from El Salvador by Seniors Poverty Over the Age of 65
In terms of seniors poverty over the age of 65, the demographic groups most similar to Immigrants from El Salvador are Yuman (13.1%, a difference of 0.44%), Mexican (13.1%, a difference of 0.48%), Immigrants from Bahamas (13.0%, a difference of 0.64%), Senegalese (13.3%, a difference of 1.1%), and Paiute (12.9%, a difference of 1.5%).
| Demographics | Rating | Rank | Seniors Poverty Over the Age of 65 |
| Salvadorans | 0.0 /100 | #274 | Tragic 12.8% |
| Immigrants | Colombia | 0.0 /100 | #275 | Tragic 12.9% |
| Immigrants | Azores | 0.0 /100 | #276 | Tragic 12.9% |
| Paiute | 0.0 /100 | #277 | Tragic 12.9% |
| Immigrants | Bahamas | 0.0 /100 | #278 | Tragic 13.0% |
| Mexicans | 0.0 /100 | #279 | Tragic 13.1% |
| Yuman | 0.0 /100 | #280 | Tragic 13.1% |
| Immigrants | El Salvador | 0.0 /100 | #281 | Tragic 13.1% |
| Senegalese | 0.0 /100 | #282 | Tragic 13.3% |
| Central Americans | 0.0 /100 | #283 | Tragic 13.4% |
| Colville | 0.0 /100 | #284 | Tragic 13.5% |
| Guatemalans | 0.0 /100 | #285 | Tragic 13.5% |
| Immigrants | Senegal | 0.0 /100 | #286 | Tragic 13.6% |
| Immigrants | Mexico | 0.0 /100 | #287 | Tragic 13.6% |
| Belizeans | 0.0 /100 | #288 | Tragic 13.6% |