Immigrants from Mexico vs Immigrants from Czechoslovakia Seniors Poverty Over the Age of 65
COMPARE
Immigrants from Mexico
Immigrants from Czechoslovakia
Seniors Poverty Over the Age of 65
Seniors Poverty Over the Age of 65 Comparison
Immigrants from Mexico
Immigrants from Czechoslovakia
13.6%
SENIORS POVERTY OVER THE AGE OF 65
0.0/ 100
METRIC RATING
287th/ 347
METRIC RANK
10.0%
SENIORS POVERTY OVER THE AGE OF 65
97.8/ 100
METRIC RATING
75th/ 347
METRIC RANK
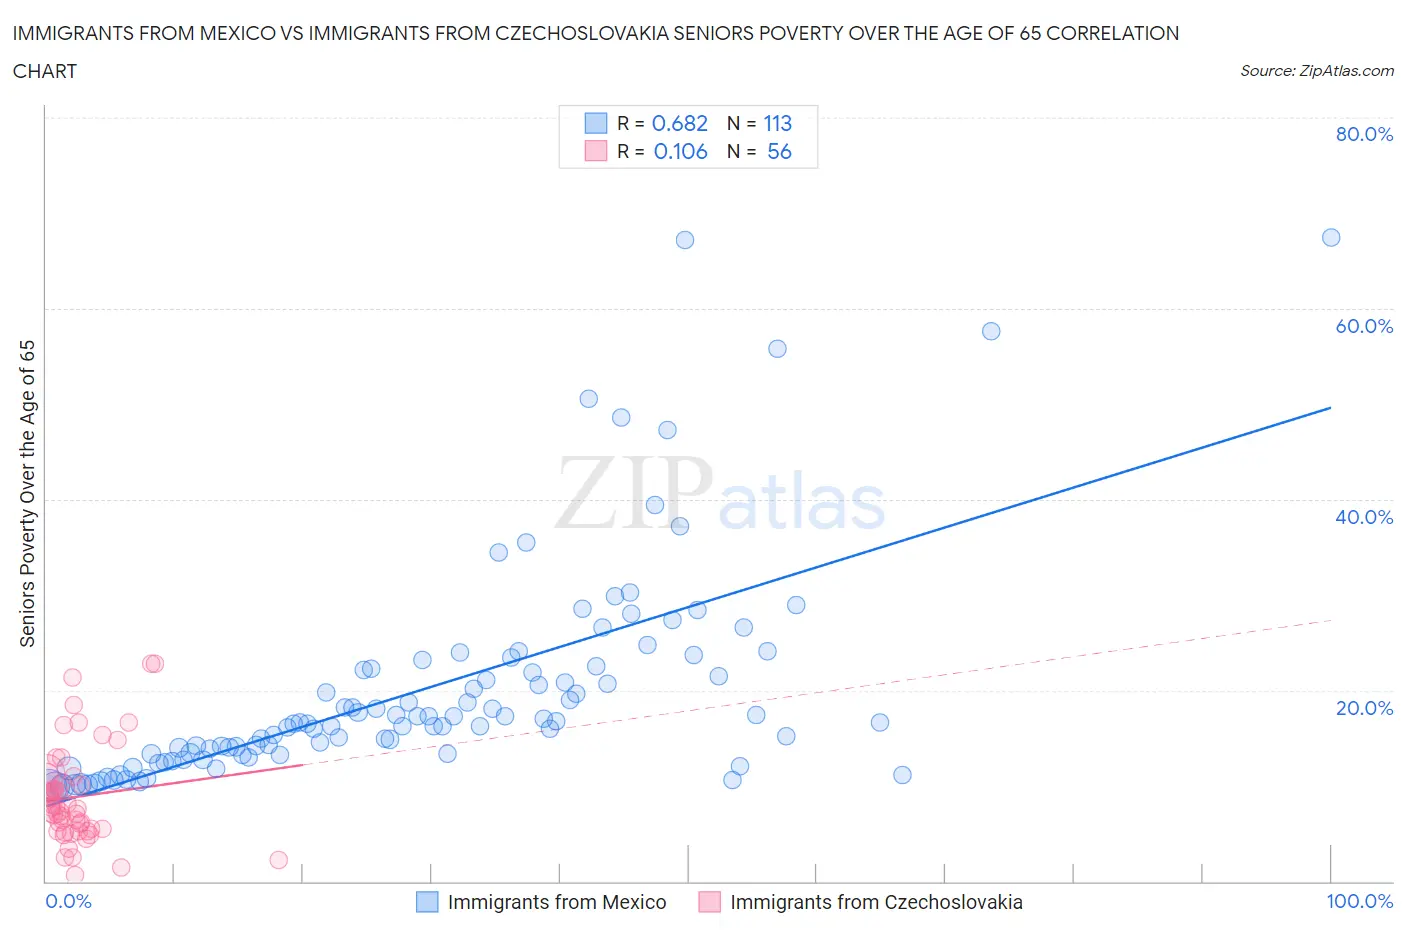
Immigrants from Mexico vs Immigrants from Czechoslovakia Seniors Poverty Over the Age of 65 Correlation Chart
The statistical analysis conducted on geographies consisting of 510,595,160 people shows a significant positive correlation between the proportion of Immigrants from Mexico and poverty level among seniors over the age of 65 in the United States with a correlation coefficient (R) of 0.682 and weighted average of 13.6%. Similarly, the statistical analysis conducted on geographies consisting of 195,302,205 people shows a poor positive correlation between the proportion of Immigrants from Czechoslovakia and poverty level among seniors over the age of 65 in the United States with a correlation coefficient (R) of 0.106 and weighted average of 10.0%, a difference of 35.7%.
Seniors Poverty Over the Age of 65 Correlation Summary
| Measurement | Immigrants from Mexico | Immigrants from Czechoslovakia |
| Minimum | 9.9% | 0.62% |
| Maximum | 67.5% | 22.7% |
| Range | 57.6% | 22.1% |
| Mean | 20.1% | 8.8% |
| Median | 16.7% | 7.7% |
| Interquartile 25% (IQ1) | 13.3% | 5.4% |
| Interquartile 75% (IQ3) | 22.4% | 10.6% |
| Interquartile Range (IQR) | 9.1% | 5.3% |
| Standard Deviation (Sample) | 11.4% | 5.1% |
| Standard Deviation (Population) | 11.3% | 5.0% |
Similar Demographics by Seniors Poverty Over the Age of 65
Demographics Similar to Immigrants from Mexico by Seniors Poverty Over the Age of 65
In terms of seniors poverty over the age of 65, the demographic groups most similar to Immigrants from Mexico are Immigrants from Senegal (13.6%, a difference of 0.12%), Belizean (13.6%, a difference of 0.14%), Guatemalan (13.5%, a difference of 0.40%), Jamaican (13.6%, a difference of 0.41%), and Immigrants from Central America (13.6%, a difference of 0.41%).
| Demographics | Rating | Rank | Seniors Poverty Over the Age of 65 |
| Yuman | 0.0 /100 | #280 | Tragic 13.1% |
| Immigrants | El Salvador | 0.0 /100 | #281 | Tragic 13.1% |
| Senegalese | 0.0 /100 | #282 | Tragic 13.3% |
| Central Americans | 0.0 /100 | #283 | Tragic 13.4% |
| Colville | 0.0 /100 | #284 | Tragic 13.5% |
| Guatemalans | 0.0 /100 | #285 | Tragic 13.5% |
| Immigrants | Senegal | 0.0 /100 | #286 | Tragic 13.6% |
| Immigrants | Mexico | 0.0 /100 | #287 | Tragic 13.6% |
| Belizeans | 0.0 /100 | #288 | Tragic 13.6% |
| Jamaicans | 0.0 /100 | #289 | Tragic 13.6% |
| Immigrants | Central America | 0.0 /100 | #290 | Tragic 13.6% |
| Blacks/African Americans | 0.0 /100 | #291 | Tragic 13.7% |
| Spanish American Indians | 0.0 /100 | #292 | Tragic 13.8% |
| Immigrants | Guatemala | 0.0 /100 | #293 | Tragic 13.8% |
| Cheyenne | 0.0 /100 | #294 | Tragic 13.9% |
Demographics Similar to Immigrants from Czechoslovakia by Seniors Poverty Over the Age of 65
In terms of seniors poverty over the age of 65, the demographic groups most similar to Immigrants from Czechoslovakia are New Zealander (10.0%, a difference of 0.050%), Immigrants from South Africa (10.0%, a difference of 0.070%), Turkish (10.0%, a difference of 0.090%), Russian (10.0%, a difference of 0.11%), and Palestinian (10.0%, a difference of 0.14%).
| Demographics | Rating | Rank | Seniors Poverty Over the Age of 65 |
| Canadians | 98.5 /100 | #68 | Exceptional 9.9% |
| Australians | 98.4 /100 | #69 | Exceptional 9.9% |
| Samoans | 98.0 /100 | #70 | Exceptional 10.0% |
| Yugoslavians | 97.9 /100 | #71 | Exceptional 10.0% |
| Palestinians | 97.9 /100 | #72 | Exceptional 10.0% |
| Russians | 97.9 /100 | #73 | Exceptional 10.0% |
| Turks | 97.9 /100 | #74 | Exceptional 10.0% |
| Immigrants | Czechoslovakia | 97.8 /100 | #75 | Exceptional 10.0% |
| New Zealanders | 97.7 /100 | #76 | Exceptional 10.0% |
| Immigrants | South Africa | 97.7 /100 | #77 | Exceptional 10.0% |
| Whites/Caucasians | 97.5 /100 | #78 | Exceptional 10.0% |
| Immigrants | Ireland | 97.5 /100 | #79 | Exceptional 10.0% |
| Koreans | 97.4 /100 | #80 | Exceptional 10.1% |
| Immigrants | Sri Lanka | 97.3 /100 | #81 | Exceptional 10.1% |
| Immigrants | Bolivia | 97.3 /100 | #82 | Exceptional 10.1% |