Immigrants from Mexico vs Honduran Child Poverty Among Boys Under 16
COMPARE
Immigrants from Mexico
Honduran
Child Poverty Among Boys Under 16
Child Poverty Among Boys Under 16 Comparison
Immigrants from Mexico
Hondurans
21.5%
CHILD POVERTY AMONG BOYS UNDER 16
0.0/ 100
METRIC RATING
308th/ 347
METRIC RANK
22.3%
CHILD POVERTY AMONG BOYS UNDER 16
0.0/ 100
METRIC RATING
323rd/ 347
METRIC RANK
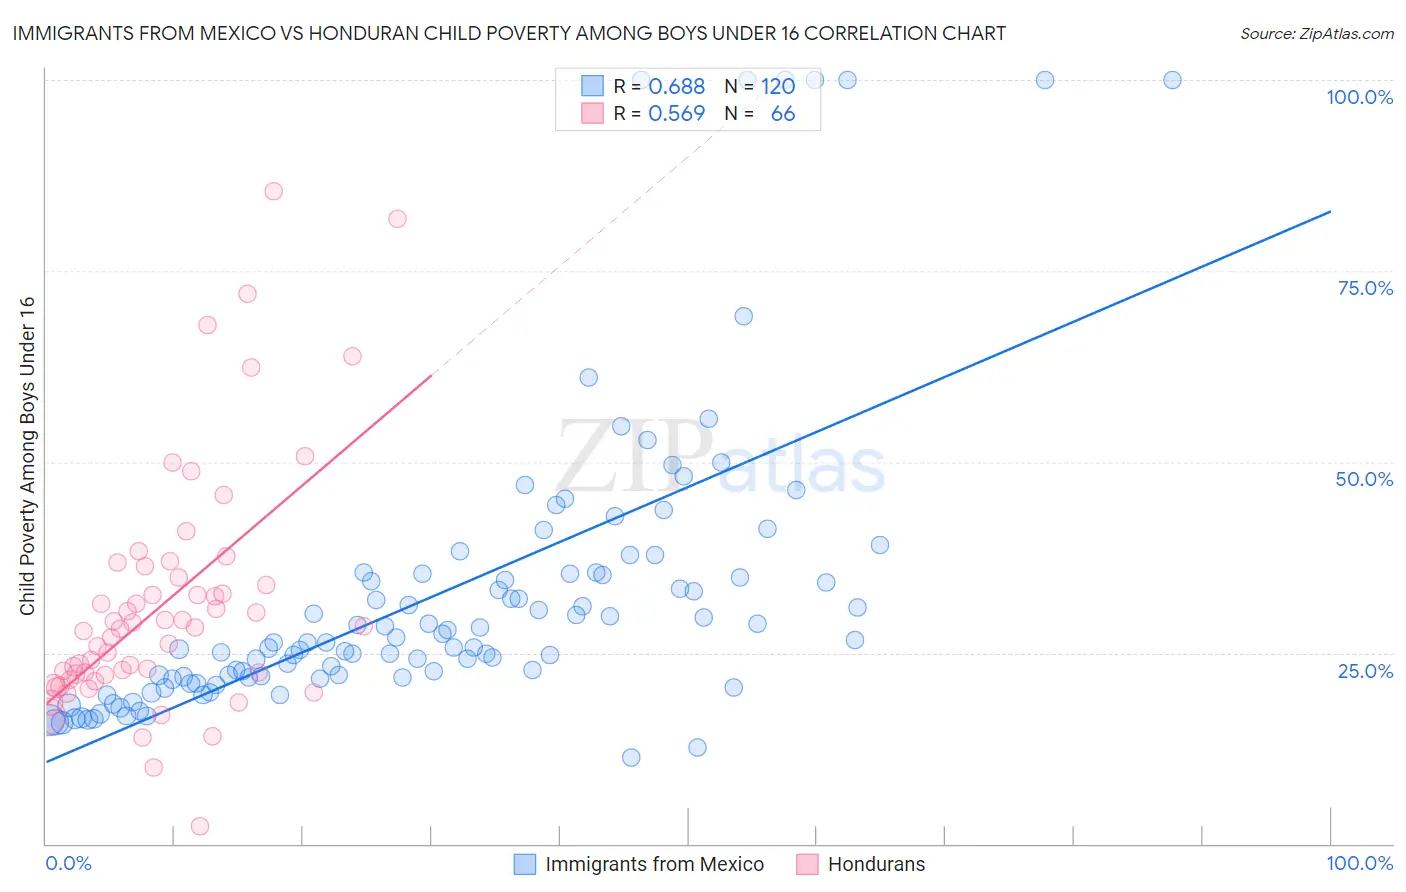
Immigrants from Mexico vs Honduran Child Poverty Among Boys Under 16 Correlation Chart
The statistical analysis conducted on geographies consisting of 502,962,166 people shows a significant positive correlation between the proportion of Immigrants from Mexico and poverty level among boys under the age of 16 in the United States with a correlation coefficient (R) of 0.688 and weighted average of 21.5%. Similarly, the statistical analysis conducted on geographies consisting of 354,725,879 people shows a substantial positive correlation between the proportion of Hondurans and poverty level among boys under the age of 16 in the United States with a correlation coefficient (R) of 0.569 and weighted average of 22.3%, a difference of 3.9%.
Child Poverty Among Boys Under 16 Correlation Summary
| Measurement | Immigrants from Mexico | Honduran |
| Minimum | 11.3% | 2.3% |
| Maximum | 100.0% | 85.5% |
| Range | 88.7% | 83.1% |
| Mean | 32.9% | 31.4% |
| Median | 26.3% | 28.2% |
| Interquartile 25% (IQ1) | 21.8% | 22.2% |
| Interquartile 75% (IQ3) | 35.4% | 34.9% |
| Interquartile Range (IQR) | 13.6% | 12.7% |
| Standard Deviation (Sample) | 19.8% | 16.0% |
| Standard Deviation (Population) | 19.7% | 15.8% |
Demographics Similar to Immigrants from Mexico and Hondurans by Child Poverty Among Boys Under 16
In terms of child poverty among boys under 16, the demographic groups most similar to Immigrants from Mexico are Seminole (21.5%, a difference of 0.18%), Creek (21.5%, a difference of 0.24%), Bahamian (21.6%, a difference of 0.35%), Immigrants from Guatemala (21.6%, a difference of 0.43%), and British West Indian (21.6%, a difference of 0.43%). Similarly, the demographic groups most similar to Hondurans are Immigrants from Congo (22.4%, a difference of 0.37%), Immigrants from Dominica (22.2%, a difference of 0.53%), Cajun (22.2%, a difference of 0.56%), Central American Indian (22.5%, a difference of 0.87%), and U.S. Virgin Islander (22.0%, a difference of 1.5%).
| Demographics | Rating | Rank | Child Poverty Among Boys Under 16 |
| Kiowa | 0.0 /100 | #305 | Tragic 21.3% |
| Immigrants | Grenada | 0.0 /100 | #306 | Tragic 21.3% |
| Choctaw | 0.0 /100 | #307 | Tragic 21.3% |
| Immigrants | Mexico | 0.0 /100 | #308 | Tragic 21.5% |
| Seminole | 0.0 /100 | #309 | Tragic 21.5% |
| Creek | 0.0 /100 | #310 | Tragic 21.5% |
| Bahamians | 0.0 /100 | #311 | Tragic 21.6% |
| Immigrants | Guatemala | 0.0 /100 | #312 | Tragic 21.6% |
| British West Indians | 0.0 /100 | #313 | Tragic 21.6% |
| Ute | 0.0 /100 | #314 | Tragic 21.6% |
| Immigrants | Somalia | 0.0 /100 | #315 | Tragic 21.7% |
| Menominee | 0.0 /100 | #316 | Tragic 21.7% |
| Africans | 0.0 /100 | #317 | Tragic 21.7% |
| Yakama | 0.0 /100 | #318 | Tragic 21.7% |
| Dutch West Indians | 0.0 /100 | #319 | Tragic 21.8% |
| U.S. Virgin Islanders | 0.0 /100 | #320 | Tragic 22.0% |
| Cajuns | 0.0 /100 | #321 | Tragic 22.2% |
| Immigrants | Dominica | 0.0 /100 | #322 | Tragic 22.2% |
| Hondurans | 0.0 /100 | #323 | Tragic 22.3% |
| Immigrants | Congo | 0.0 /100 | #324 | Tragic 22.4% |
| Central American Indians | 0.0 /100 | #325 | Tragic 22.5% |