Immigrants from Lithuania vs Immigrants from Zaire Seniors Poverty Over the Age of 75
COMPARE
Immigrants from Lithuania
Immigrants from Zaire
Seniors Poverty Over the Age of 75
Seniors Poverty Over the Age of 75 Comparison
Immigrants from Lithuania
Immigrants from Zaire
11.0%
SENIORS POVERTY OVER THE AGE OF 75
99.2/ 100
METRIC RATING
41st/ 347
METRIC RANK
12.0%
SENIORS POVERTY OVER THE AGE OF 75
67.6/ 100
METRIC RATING
148th/ 347
METRIC RANK
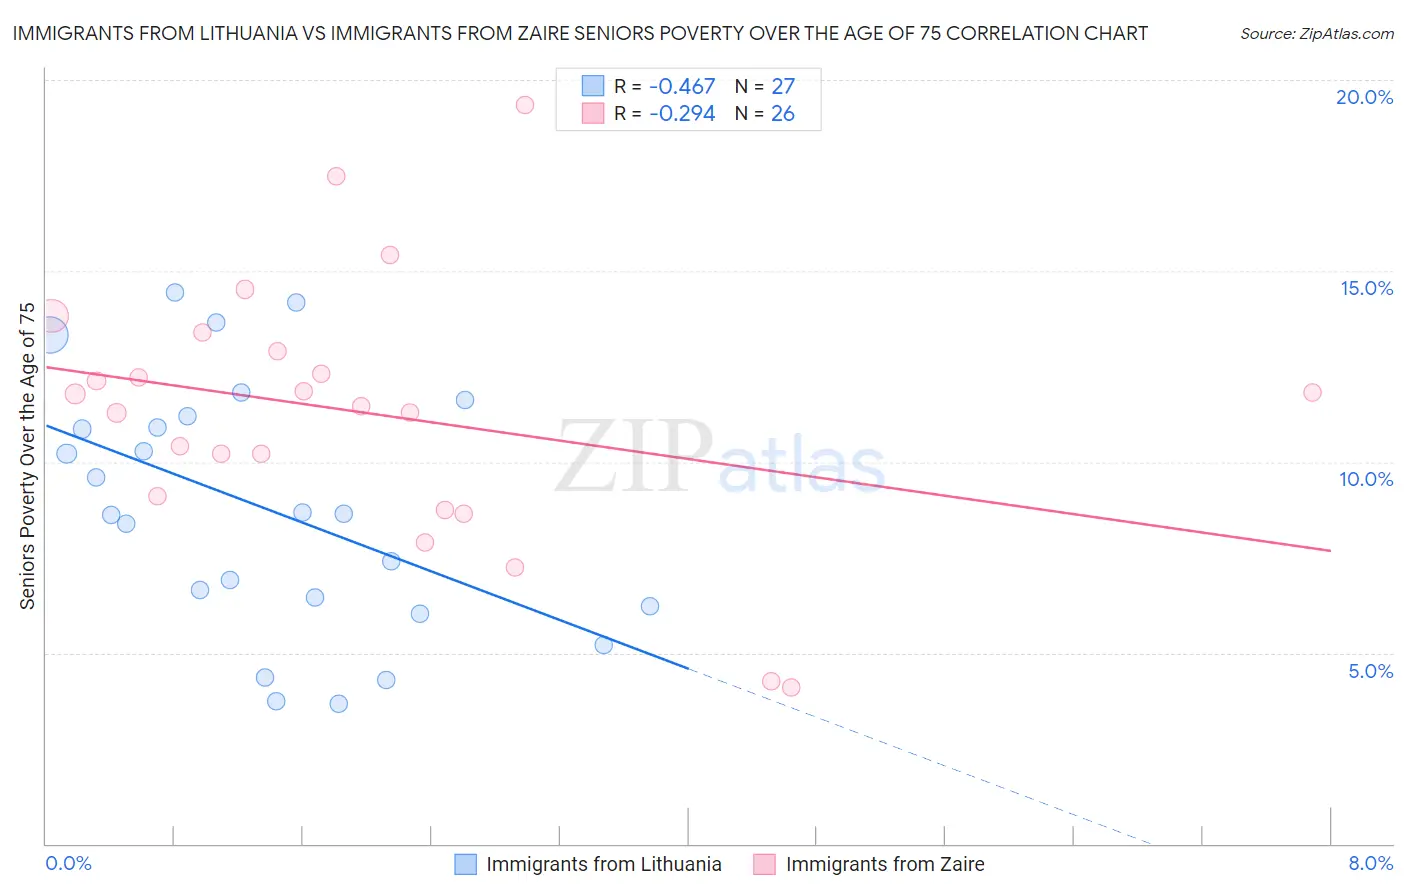
Immigrants from Lithuania vs Immigrants from Zaire Seniors Poverty Over the Age of 75 Correlation Chart
The statistical analysis conducted on geographies consisting of 117,369,343 people shows a moderate negative correlation between the proportion of Immigrants from Lithuania and poverty level among seniors over the age of 75 in the United States with a correlation coefficient (R) of -0.467 and weighted average of 11.0%. Similarly, the statistical analysis conducted on geographies consisting of 106,901,220 people shows a weak negative correlation between the proportion of Immigrants from Zaire and poverty level among seniors over the age of 75 in the United States with a correlation coefficient (R) of -0.294 and weighted average of 12.0%, a difference of 9.3%.
Seniors Poverty Over the Age of 75 Correlation Summary
| Measurement | Immigrants from Lithuania | Immigrants from Zaire |
| Minimum | 3.7% | 4.1% |
| Maximum | 14.4% | 19.4% |
| Range | 10.8% | 15.3% |
| Mean | 8.8% | 11.3% |
| Median | 8.6% | 11.6% |
| Interquartile 25% (IQ1) | 6.2% | 9.1% |
| Interquartile 75% (IQ3) | 11.2% | 12.9% |
| Interquartile Range (IQR) | 5.0% | 3.8% |
| Standard Deviation (Sample) | 3.3% | 3.5% |
| Standard Deviation (Population) | 3.2% | 3.4% |
Similar Demographics by Seniors Poverty Over the Age of 75
Demographics Similar to Immigrants from Lithuania by Seniors Poverty Over the Age of 75
In terms of seniors poverty over the age of 75, the demographic groups most similar to Immigrants from Lithuania are Austrian (11.0%, a difference of 0.27%), Celtic (11.0%, a difference of 0.32%), Belgian (11.0%, a difference of 0.35%), Thai (10.9%, a difference of 0.49%), and Carpatho Rusyn (11.1%, a difference of 0.62%).
| Demographics | Rating | Rank | Seniors Poverty Over the Age of 75 |
| Italians | 99.7 /100 | #34 | Exceptional 10.8% |
| Luxembourgers | 99.6 /100 | #35 | Exceptional 10.8% |
| Scotch-Irish | 99.6 /100 | #36 | Exceptional 10.8% |
| Latvians | 99.6 /100 | #37 | Exceptional 10.8% |
| Finns | 99.6 /100 | #38 | Exceptional 10.8% |
| Czechoslovakians | 99.4 /100 | #39 | Exceptional 10.9% |
| Thais | 99.4 /100 | #40 | Exceptional 10.9% |
| Immigrants | Lithuania | 99.2 /100 | #41 | Exceptional 11.0% |
| Austrians | 99.1 /100 | #42 | Exceptional 11.0% |
| Celtics | 99.1 /100 | #43 | Exceptional 11.0% |
| Belgians | 99.1 /100 | #44 | Exceptional 11.0% |
| Carpatho Rusyns | 99.0 /100 | #45 | Exceptional 11.1% |
| Greeks | 99.0 /100 | #46 | Exceptional 11.1% |
| Hawaiians | 98.8 /100 | #47 | Exceptional 11.1% |
| French | 98.7 /100 | #48 | Exceptional 11.1% |
Demographics Similar to Immigrants from Zaire by Seniors Poverty Over the Age of 75
In terms of seniors poverty over the age of 75, the demographic groups most similar to Immigrants from Zaire are Asian (12.0%, a difference of 0.020%), Cypriot (12.0%, a difference of 0.030%), Immigrants from Latvia (12.0%, a difference of 0.15%), Cherokee (12.0%, a difference of 0.17%), and Immigrants from Korea (12.0%, a difference of 0.20%).
| Demographics | Rating | Rank | Seniors Poverty Over the Age of 75 |
| Immigrants | Cameroon | 71.7 /100 | #141 | Good 12.0% |
| Immigrants | Laos | 71.5 /100 | #142 | Good 12.0% |
| Americans | 71.0 /100 | #143 | Good 12.0% |
| Hmong | 70.8 /100 | #144 | Good 12.0% |
| Immigrants | Belgium | 70.8 /100 | #145 | Good 12.0% |
| Bangladeshis | 70.4 /100 | #146 | Good 12.0% |
| Immigrants | Latvia | 69.1 /100 | #147 | Good 12.0% |
| Immigrants | Zaire | 67.6 /100 | #148 | Good 12.0% |
| Asians | 67.4 /100 | #149 | Good 12.0% |
| Cypriots | 67.3 /100 | #150 | Good 12.0% |
| Cherokee | 65.8 /100 | #151 | Good 12.0% |
| Immigrants | Korea | 65.5 /100 | #152 | Good 12.0% |
| Immigrants | Turkey | 64.7 /100 | #153 | Good 12.0% |
| Cambodians | 64.0 /100 | #154 | Good 12.0% |
| Indonesians | 62.6 /100 | #155 | Good 12.1% |