Immigrants from Jamaica vs Immigrants from Zaire Seniors Poverty Over the Age of 75
COMPARE
Immigrants from Jamaica
Immigrants from Zaire
Seniors Poverty Over the Age of 75
Seniors Poverty Over the Age of 75 Comparison
Immigrants from Jamaica
Immigrants from Zaire
15.3%
SENIORS POVERTY OVER THE AGE OF 75
0.0/ 100
METRIC RATING
294th/ 347
METRIC RANK
12.0%
SENIORS POVERTY OVER THE AGE OF 75
67.6/ 100
METRIC RATING
148th/ 347
METRIC RANK
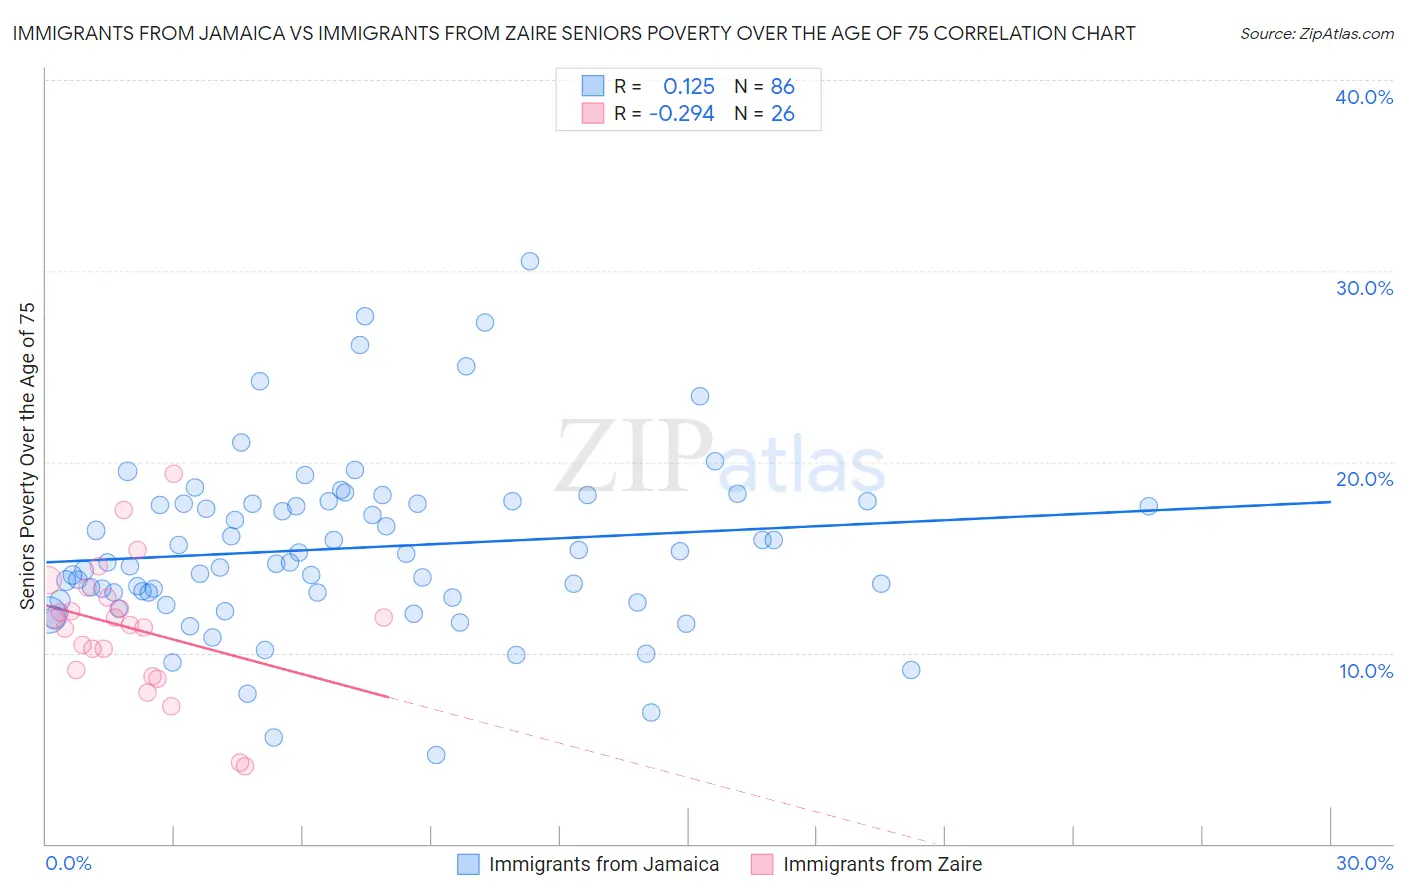
Immigrants from Jamaica vs Immigrants from Zaire Seniors Poverty Over the Age of 75 Correlation Chart
The statistical analysis conducted on geographies consisting of 298,715,643 people shows a poor positive correlation between the proportion of Immigrants from Jamaica and poverty level among seniors over the age of 75 in the United States with a correlation coefficient (R) of 0.125 and weighted average of 15.3%. Similarly, the statistical analysis conducted on geographies consisting of 106,901,220 people shows a weak negative correlation between the proportion of Immigrants from Zaire and poverty level among seniors over the age of 75 in the United States with a correlation coefficient (R) of -0.294 and weighted average of 12.0%, a difference of 27.8%.
Seniors Poverty Over the Age of 75 Correlation Summary
| Measurement | Immigrants from Jamaica | Immigrants from Zaire |
| Minimum | 4.7% | 4.1% |
| Maximum | 30.5% | 19.4% |
| Range | 25.9% | 15.3% |
| Mean | 15.5% | 11.3% |
| Median | 14.7% | 11.6% |
| Interquartile 25% (IQ1) | 12.9% | 9.1% |
| Interquartile 75% (IQ3) | 17.8% | 12.9% |
| Interquartile Range (IQR) | 4.9% | 3.8% |
| Standard Deviation (Sample) | 4.6% | 3.5% |
| Standard Deviation (Population) | 4.6% | 3.4% |
Similar Demographics by Seniors Poverty Over the Age of 75
Demographics Similar to Immigrants from Jamaica by Seniors Poverty Over the Age of 75
In terms of seniors poverty over the age of 75, the demographic groups most similar to Immigrants from Jamaica are U.S. Virgin Islander (15.4%, a difference of 0.19%), Yuman (15.4%, a difference of 0.37%), Apache (15.3%, a difference of 0.45%), Honduran (15.4%, a difference of 0.65%), and Colville (15.2%, a difference of 0.85%).
| Demographics | Rating | Rank | Seniors Poverty Over the Age of 75 |
| Immigrants | Guatemala | 0.0 /100 | #287 | Tragic 15.1% |
| Jamaicans | 0.0 /100 | #288 | Tragic 15.1% |
| Immigrants | Belize | 0.0 /100 | #289 | Tragic 15.2% |
| Immigrants | Azores | 0.0 /100 | #290 | Tragic 15.2% |
| Paiute | 0.0 /100 | #291 | Tragic 15.2% |
| Colville | 0.0 /100 | #292 | Tragic 15.2% |
| Apache | 0.0 /100 | #293 | Tragic 15.3% |
| Immigrants | Jamaica | 0.0 /100 | #294 | Tragic 15.3% |
| U.S. Virgin Islanders | 0.0 /100 | #295 | Tragic 15.4% |
| Yuman | 0.0 /100 | #296 | Tragic 15.4% |
| Hondurans | 0.0 /100 | #297 | Tragic 15.4% |
| Natives/Alaskans | 0.0 /100 | #298 | Tragic 15.5% |
| Spanish American Indians | 0.0 /100 | #299 | Tragic 15.5% |
| Bahamians | 0.0 /100 | #300 | Tragic 15.5% |
| Immigrants | Latin America | 0.0 /100 | #301 | Tragic 15.6% |
Demographics Similar to Immigrants from Zaire by Seniors Poverty Over the Age of 75
In terms of seniors poverty over the age of 75, the demographic groups most similar to Immigrants from Zaire are Asian (12.0%, a difference of 0.020%), Cypriot (12.0%, a difference of 0.030%), Immigrants from Latvia (12.0%, a difference of 0.15%), Cherokee (12.0%, a difference of 0.17%), and Immigrants from Korea (12.0%, a difference of 0.20%).
| Demographics | Rating | Rank | Seniors Poverty Over the Age of 75 |
| Immigrants | Cameroon | 71.7 /100 | #141 | Good 12.0% |
| Immigrants | Laos | 71.5 /100 | #142 | Good 12.0% |
| Americans | 71.0 /100 | #143 | Good 12.0% |
| Hmong | 70.8 /100 | #144 | Good 12.0% |
| Immigrants | Belgium | 70.8 /100 | #145 | Good 12.0% |
| Bangladeshis | 70.4 /100 | #146 | Good 12.0% |
| Immigrants | Latvia | 69.1 /100 | #147 | Good 12.0% |
| Immigrants | Zaire | 67.6 /100 | #148 | Good 12.0% |
| Asians | 67.4 /100 | #149 | Good 12.0% |
| Cypriots | 67.3 /100 | #150 | Good 12.0% |
| Cherokee | 65.8 /100 | #151 | Good 12.0% |
| Immigrants | Korea | 65.5 /100 | #152 | Good 12.0% |
| Immigrants | Turkey | 64.7 /100 | #153 | Good 12.0% |
| Cambodians | 64.0 /100 | #154 | Good 12.0% |
| Indonesians | 62.6 /100 | #155 | Good 12.1% |