Immigrants from Jordan vs Welsh Seniors Poverty Over the Age of 65
COMPARE
Immigrants from Jordan
Welsh
Seniors Poverty Over the Age of 65
Seniors Poverty Over the Age of 65 Comparison
Immigrants from Jordan
Welsh
10.2%
SENIORS POVERTY OVER THE AGE OF 65
94.7/ 100
METRIC RATING
101st/ 347
METRIC RANK
9.3%
SENIORS POVERTY OVER THE AGE OF 65
99.9/ 100
METRIC RATING
23rd/ 347
METRIC RANK
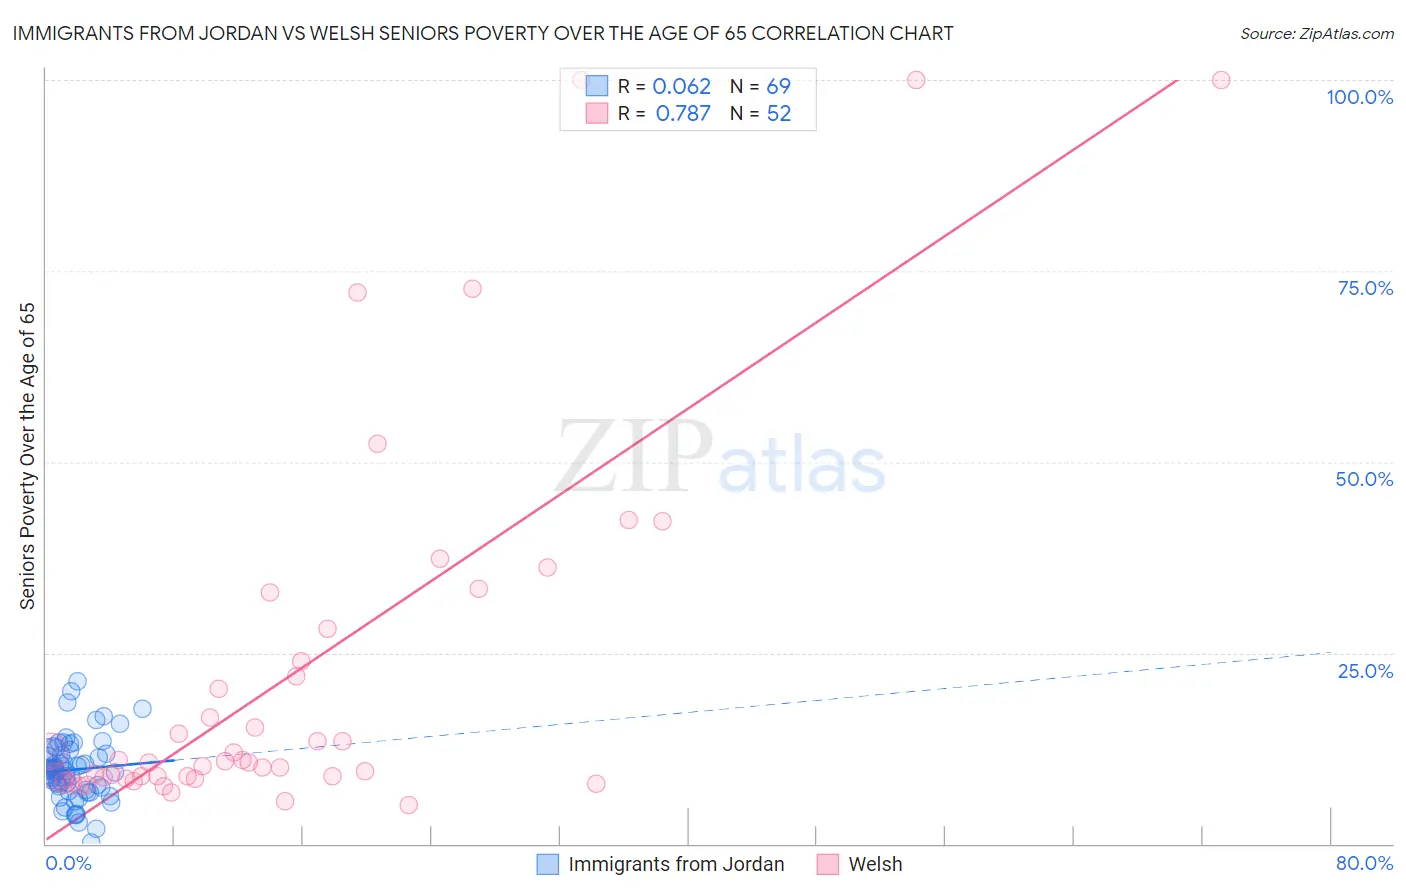
Immigrants from Jordan vs Welsh Seniors Poverty Over the Age of 65 Correlation Chart
The statistical analysis conducted on geographies consisting of 181,113,233 people shows a slight positive correlation between the proportion of Immigrants from Jordan and poverty level among seniors over the age of 65 in the United States with a correlation coefficient (R) of 0.062 and weighted average of 10.2%. Similarly, the statistical analysis conducted on geographies consisting of 524,701,906 people shows a strong positive correlation between the proportion of Welsh and poverty level among seniors over the age of 65 in the United States with a correlation coefficient (R) of 0.787 and weighted average of 9.3%, a difference of 10.6%.
Seniors Poverty Over the Age of 65 Correlation Summary
| Measurement | Immigrants from Jordan | Welsh |
| Minimum | 0.093% | 5.0% |
| Maximum | 21.3% | 100.0% |
| Range | 21.2% | 95.0% |
| Mean | 9.7% | 22.4% |
| Median | 9.7% | 10.7% |
| Interquartile 25% (IQ1) | 7.1% | 8.7% |
| Interquartile 75% (IQ3) | 12.0% | 26.0% |
| Interquartile Range (IQR) | 4.9% | 17.3% |
| Standard Deviation (Sample) | 4.1% | 24.8% |
| Standard Deviation (Population) | 4.1% | 24.6% |
Similar Demographics by Seniors Poverty Over the Age of 65
Demographics Similar to Immigrants from Jordan by Seniors Poverty Over the Age of 65
In terms of seniors poverty over the age of 65, the demographic groups most similar to Immigrants from Jordan are Delaware (10.2%, a difference of 0.10%), Icelander (10.3%, a difference of 0.15%), South African (10.3%, a difference of 0.19%), Aleut (10.3%, a difference of 0.26%), and Kenyan (10.3%, a difference of 0.28%).
| Demographics | Rating | Rank | Seniors Poverty Over the Age of 65 |
| Immigrants | Germany | 96.7 /100 | #94 | Exceptional 10.1% |
| Immigrants | Japan | 96.3 /100 | #95 | Exceptional 10.1% |
| Basques | 95.9 /100 | #96 | Exceptional 10.2% |
| Immigrants | Pakistan | 95.7 /100 | #97 | Exceptional 10.2% |
| Immigrants | Kuwait | 95.5 /100 | #98 | Exceptional 10.2% |
| Cypriots | 95.5 /100 | #99 | Exceptional 10.2% |
| Marshallese | 95.3 /100 | #100 | Exceptional 10.2% |
| Immigrants | Jordan | 94.7 /100 | #101 | Exceptional 10.2% |
| Delaware | 94.5 /100 | #102 | Exceptional 10.2% |
| Icelanders | 94.4 /100 | #103 | Exceptional 10.3% |
| South Africans | 94.3 /100 | #104 | Exceptional 10.3% |
| Aleuts | 94.1 /100 | #105 | Exceptional 10.3% |
| Kenyans | 94.1 /100 | #106 | Exceptional 10.3% |
| Hawaiians | 93.9 /100 | #107 | Exceptional 10.3% |
| Immigrants | Croatia | 93.9 /100 | #108 | Exceptional 10.3% |
Demographics Similar to Welsh by Seniors Poverty Over the Age of 65
In terms of seniors poverty over the age of 65, the demographic groups most similar to Welsh are Slovene (9.3%, a difference of 0.050%), Bulgarian (9.3%, a difference of 0.070%), Luxembourger (9.2%, a difference of 0.080%), Irish (9.3%, a difference of 0.35%), and Thai (9.2%, a difference of 0.37%).
| Demographics | Rating | Rank | Seniors Poverty Over the Age of 65 |
| Europeans | 99.9 /100 | #16 | Exceptional 9.2% |
| Scottish | 99.9 /100 | #17 | Exceptional 9.2% |
| Slovaks | 99.9 /100 | #18 | Exceptional 9.2% |
| Swiss | 99.9 /100 | #19 | Exceptional 9.2% |
| Thais | 99.9 /100 | #20 | Exceptional 9.2% |
| Luxembourgers | 99.9 /100 | #21 | Exceptional 9.2% |
| Slovenes | 99.9 /100 | #22 | Exceptional 9.3% |
| Welsh | 99.9 /100 | #23 | Exceptional 9.3% |
| Bulgarians | 99.9 /100 | #24 | Exceptional 9.3% |
| Irish | 99.9 /100 | #25 | Exceptional 9.3% |
| Immigrants | Scotland | 99.9 /100 | #26 | Exceptional 9.3% |
| Italians | 99.9 /100 | #27 | Exceptional 9.3% |
| Tongans | 99.9 /100 | #28 | Exceptional 9.3% |
| Bhutanese | 99.9 /100 | #29 | Exceptional 9.3% |
| Menominee | 99.8 /100 | #30 | Exceptional 9.4% |