Immigrants from Jordan vs Immigrants from Venezuela Seniors Poverty Over the Age of 65
COMPARE
Immigrants from Jordan
Immigrants from Venezuela
Seniors Poverty Over the Age of 65
Seniors Poverty Over the Age of 65 Comparison
Immigrants from Jordan
Immigrants from Venezuela
10.2%
SENIORS POVERTY OVER THE AGE OF 65
94.7/ 100
METRIC RATING
101st/ 347
METRIC RANK
12.7%
SENIORS POVERTY OVER THE AGE OF 65
0.1/ 100
METRIC RATING
269th/ 347
METRIC RANK
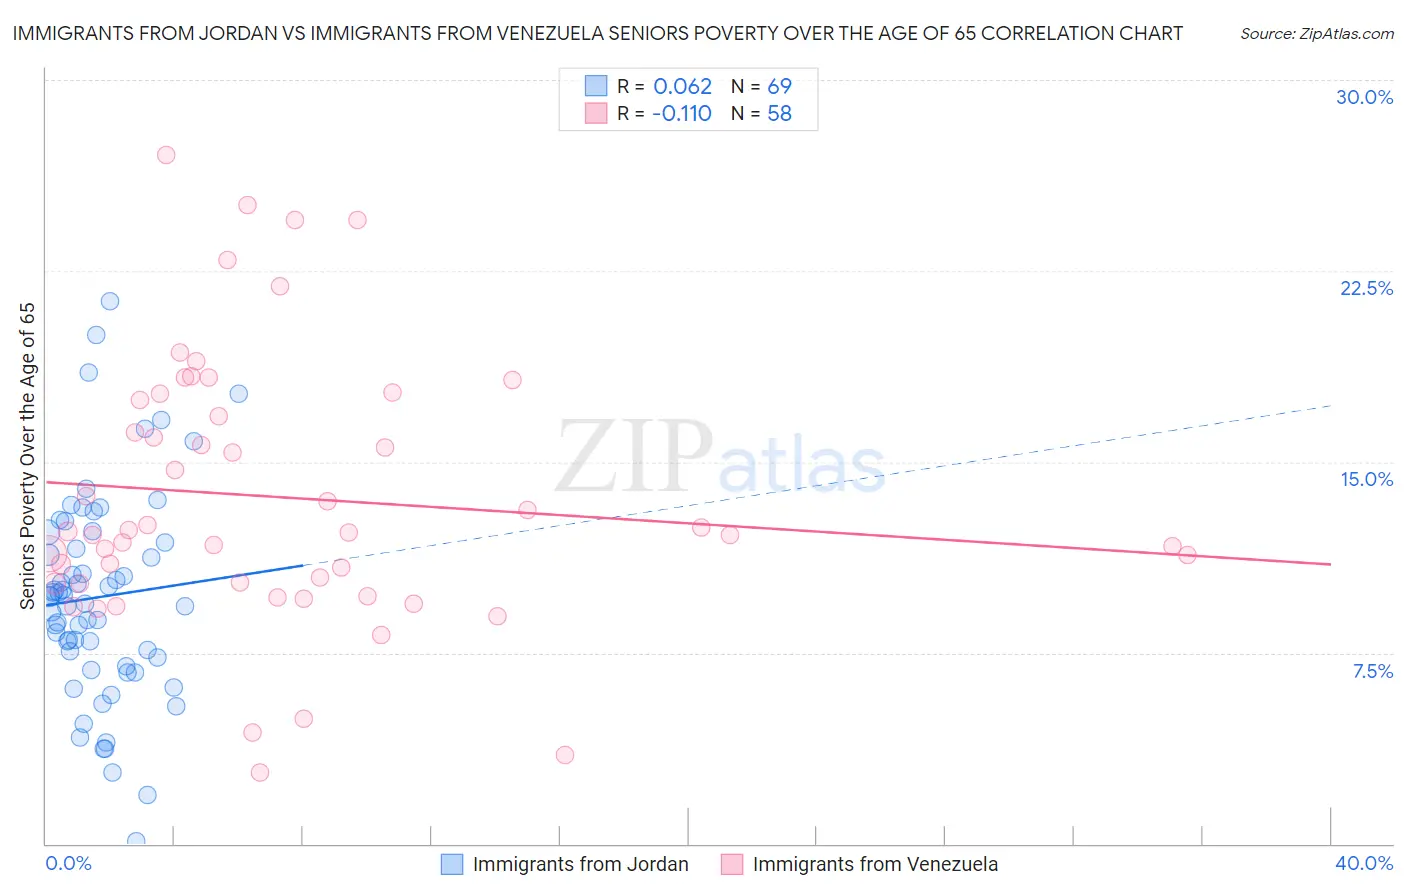
Immigrants from Jordan vs Immigrants from Venezuela Seniors Poverty Over the Age of 65 Correlation Chart
The statistical analysis conducted on geographies consisting of 181,113,233 people shows a slight positive correlation between the proportion of Immigrants from Jordan and poverty level among seniors over the age of 65 in the United States with a correlation coefficient (R) of 0.062 and weighted average of 10.2%. Similarly, the statistical analysis conducted on geographies consisting of 287,189,171 people shows a poor negative correlation between the proportion of Immigrants from Venezuela and poverty level among seniors over the age of 65 in the United States with a correlation coefficient (R) of -0.110 and weighted average of 12.7%, a difference of 24.1%.
Seniors Poverty Over the Age of 65 Correlation Summary
| Measurement | Immigrants from Jordan | Immigrants from Venezuela |
| Minimum | 0.093% | 2.8% |
| Maximum | 21.3% | 27.0% |
| Range | 21.2% | 24.3% |
| Mean | 9.7% | 13.6% |
| Median | 9.7% | 12.2% |
| Interquartile 25% (IQ1) | 7.1% | 10.2% |
| Interquartile 75% (IQ3) | 12.0% | 17.4% |
| Interquartile Range (IQR) | 4.9% | 7.2% |
| Standard Deviation (Sample) | 4.1% | 5.3% |
| Standard Deviation (Population) | 4.1% | 5.2% |
Similar Demographics by Seniors Poverty Over the Age of 65
Demographics Similar to Immigrants from Jordan by Seniors Poverty Over the Age of 65
In terms of seniors poverty over the age of 65, the demographic groups most similar to Immigrants from Jordan are Delaware (10.2%, a difference of 0.10%), Icelander (10.3%, a difference of 0.15%), South African (10.3%, a difference of 0.19%), Aleut (10.3%, a difference of 0.26%), and Kenyan (10.3%, a difference of 0.28%).
| Demographics | Rating | Rank | Seniors Poverty Over the Age of 65 |
| Immigrants | Germany | 96.7 /100 | #94 | Exceptional 10.1% |
| Immigrants | Japan | 96.3 /100 | #95 | Exceptional 10.1% |
| Basques | 95.9 /100 | #96 | Exceptional 10.2% |
| Immigrants | Pakistan | 95.7 /100 | #97 | Exceptional 10.2% |
| Immigrants | Kuwait | 95.5 /100 | #98 | Exceptional 10.2% |
| Cypriots | 95.5 /100 | #99 | Exceptional 10.2% |
| Marshallese | 95.3 /100 | #100 | Exceptional 10.2% |
| Immigrants | Jordan | 94.7 /100 | #101 | Exceptional 10.2% |
| Delaware | 94.5 /100 | #102 | Exceptional 10.2% |
| Icelanders | 94.4 /100 | #103 | Exceptional 10.3% |
| South Africans | 94.3 /100 | #104 | Exceptional 10.3% |
| Aleuts | 94.1 /100 | #105 | Exceptional 10.3% |
| Kenyans | 94.1 /100 | #106 | Exceptional 10.3% |
| Hawaiians | 93.9 /100 | #107 | Exceptional 10.3% |
| Immigrants | Croatia | 93.9 /100 | #108 | Exceptional 10.3% |
Demographics Similar to Immigrants from Venezuela by Seniors Poverty Over the Age of 65
In terms of seniors poverty over the age of 65, the demographic groups most similar to Immigrants from Venezuela are Immigrants from South America (12.7%, a difference of 0.24%), Immigrants from Ghana (12.8%, a difference of 0.52%), Immigrants from Uruguay (12.8%, a difference of 0.55%), Immigrants from Somalia (12.6%, a difference of 0.60%), and Kiowa (12.8%, a difference of 0.67%).
| Demographics | Rating | Rank | Seniors Poverty Over the Age of 65 |
| Venezuelans | 0.1 /100 | #262 | Tragic 12.5% |
| Soviet Union | 0.1 /100 | #263 | Tragic 12.6% |
| Inupiat | 0.1 /100 | #264 | Tragic 12.6% |
| Immigrants | Western Africa | 0.1 /100 | #265 | Tragic 12.6% |
| Africans | 0.1 /100 | #266 | Tragic 12.6% |
| Blackfeet | 0.1 /100 | #267 | Tragic 12.6% |
| Immigrants | Somalia | 0.1 /100 | #268 | Tragic 12.6% |
| Immigrants | Venezuela | 0.1 /100 | #269 | Tragic 12.7% |
| Immigrants | South America | 0.1 /100 | #270 | Tragic 12.7% |
| Immigrants | Ghana | 0.1 /100 | #271 | Tragic 12.8% |
| Immigrants | Uruguay | 0.1 /100 | #272 | Tragic 12.8% |
| Kiowa | 0.0 /100 | #273 | Tragic 12.8% |
| Salvadorans | 0.0 /100 | #274 | Tragic 12.8% |
| Immigrants | Colombia | 0.0 /100 | #275 | Tragic 12.9% |
| Immigrants | Azores | 0.0 /100 | #276 | Tragic 12.9% |