Immigrants from Italy vs Immigrants from Kuwait Seniors Poverty Over the Age of 75
COMPARE
Immigrants from Italy
Immigrants from Kuwait
Seniors Poverty Over the Age of 75
Seniors Poverty Over the Age of 75 Comparison
Immigrants from Italy
Immigrants from Kuwait
11.8%
SENIORS POVERTY OVER THE AGE OF 75
84.0/ 100
METRIC RATING
123rd/ 347
METRIC RANK
11.6%
SENIORS POVERTY OVER THE AGE OF 75
90.5/ 100
METRIC RATING
103rd/ 347
METRIC RANK
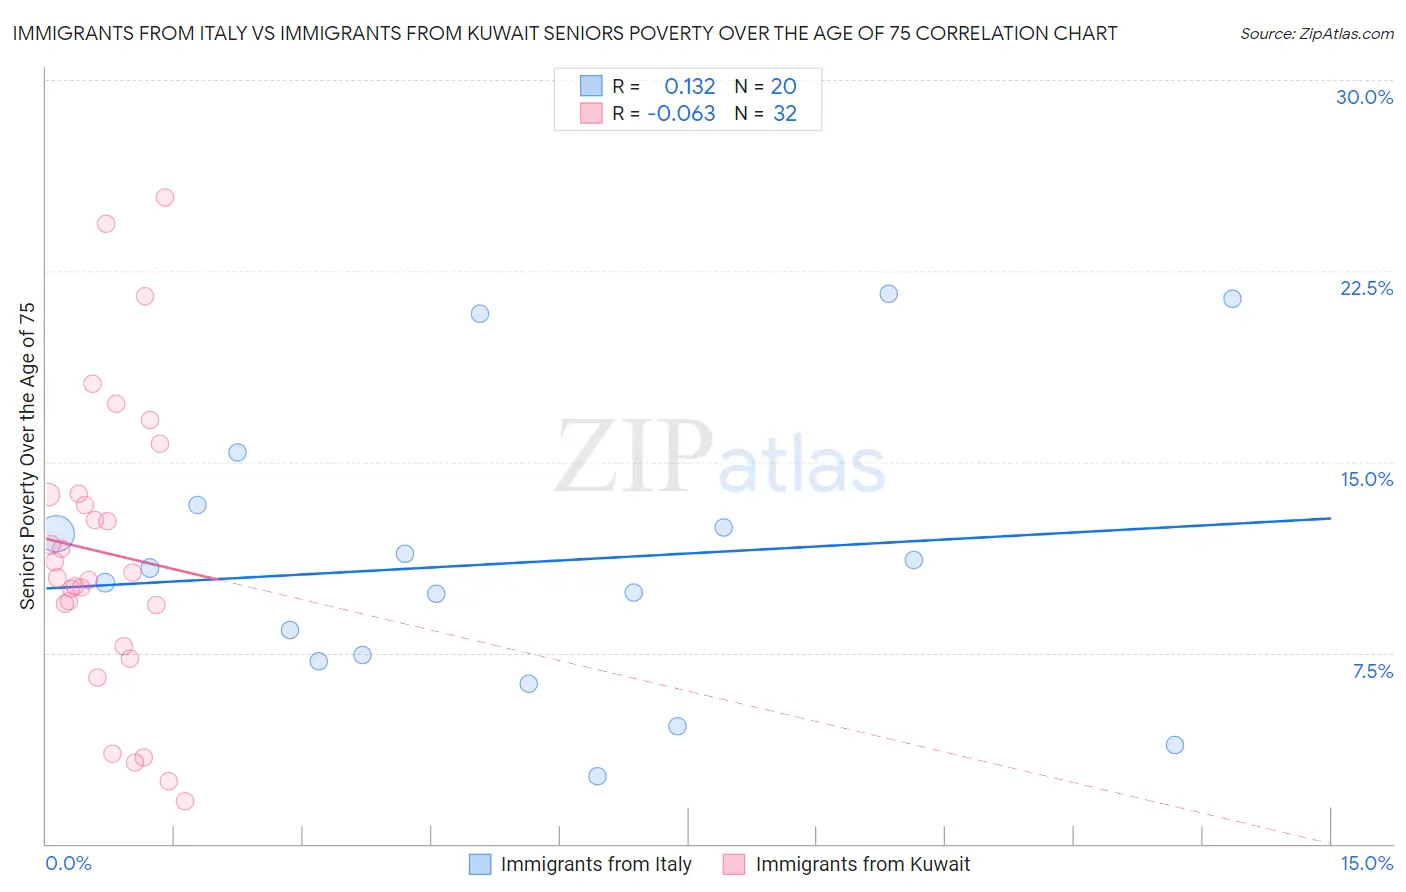
Immigrants from Italy vs Immigrants from Kuwait Seniors Poverty Over the Age of 75 Correlation Chart
The statistical analysis conducted on geographies consisting of 321,525,031 people shows a poor positive correlation between the proportion of Immigrants from Italy and poverty level among seniors over the age of 75 in the United States with a correlation coefficient (R) of 0.132 and weighted average of 11.8%. Similarly, the statistical analysis conducted on geographies consisting of 136,522,222 people shows a slight negative correlation between the proportion of Immigrants from Kuwait and poverty level among seniors over the age of 75 in the United States with a correlation coefficient (R) of -0.063 and weighted average of 11.6%, a difference of 1.3%.
Seniors Poverty Over the Age of 75 Correlation Summary
| Measurement | Immigrants from Italy | Immigrants from Kuwait |
| Minimum | 2.6% | 1.7% |
| Maximum | 21.6% | 25.4% |
| Range | 19.0% | 23.7% |
| Mean | 11.0% | 11.4% |
| Median | 10.5% | 10.5% |
| Interquartile 25% (IQ1) | 7.3% | 8.6% |
| Interquartile 75% (IQ3) | 12.9% | 13.7% |
| Interquartile Range (IQR) | 5.6% | 5.1% |
| Standard Deviation (Sample) | 5.5% | 5.8% |
| Standard Deviation (Population) | 5.3% | 5.7% |
Demographics Similar to Immigrants from Italy and Immigrants from Kuwait by Seniors Poverty Over the Age of 75
In terms of seniors poverty over the age of 75, the demographic groups most similar to Immigrants from Italy are Pakistani (11.8%, a difference of 0.0%), Malaysian (11.8%, a difference of 0.010%), Immigrants from Nepal (11.8%, a difference of 0.090%), Immigrants from Uganda (11.8%, a difference of 0.12%), and Immigrants from Zimbabwe (11.7%, a difference of 0.25%). Similarly, the demographic groups most similar to Immigrants from Kuwait are Immigrants from Singapore (11.6%, a difference of 0.050%), Chickasaw (11.6%, a difference of 0.060%), Russian (11.6%, a difference of 0.14%), Immigrants from Oceania (11.7%, a difference of 0.25%), and Turkish (11.7%, a difference of 0.26%).
| Demographics | Rating | Rank | Seniors Poverty Over the Age of 75 |
| Immigrants | Kuwait | 90.5 /100 | #103 | Exceptional 11.6% |
| Immigrants | Singapore | 90.3 /100 | #104 | Exceptional 11.6% |
| Chickasaw | 90.2 /100 | #105 | Exceptional 11.6% |
| Russians | 89.9 /100 | #106 | Excellent 11.6% |
| Immigrants | Oceania | 89.4 /100 | #107 | Excellent 11.7% |
| Turks | 89.4 /100 | #108 | Excellent 11.7% |
| South Africans | 89.3 /100 | #109 | Excellent 11.7% |
| Immigrants | Jordan | 88.7 /100 | #110 | Excellent 11.7% |
| Burmese | 88.7 /100 | #111 | Excellent 11.7% |
| Immigrants | Bolivia | 88.4 /100 | #112 | Excellent 11.7% |
| Immigrants | Czechoslovakia | 87.0 /100 | #113 | Excellent 11.7% |
| Ukrainians | 86.9 /100 | #114 | Excellent 11.7% |
| New Zealanders | 86.3 /100 | #115 | Excellent 11.7% |
| Iraqis | 86.3 /100 | #116 | Excellent 11.7% |
| Icelanders | 85.7 /100 | #117 | Excellent 11.7% |
| Immigrants | Zimbabwe | 85.5 /100 | #118 | Excellent 11.7% |
| Immigrants | Uganda | 84.8 /100 | #119 | Excellent 11.8% |
| Immigrants | Nepal | 84.5 /100 | #120 | Excellent 11.8% |
| Malaysians | 84.1 /100 | #121 | Excellent 11.8% |
| Pakistanis | 84.0 /100 | #122 | Excellent 11.8% |
| Immigrants | Italy | 84.0 /100 | #123 | Excellent 11.8% |