Immigrants from Ireland vs Alaskan Athabascan Child Poverty Under the Age of 16
COMPARE
Immigrants from Ireland
Alaskan Athabascan
Child Poverty Under the Age of 16
Child Poverty Under the Age of 16 Comparison
Immigrants from Ireland
Alaskan Athabascans
12.7%
CHILD POVERTY UNDER THE AGE OF 16
99.9/ 100
METRIC RATING
12th/ 347
METRIC RANK
17.5%
CHILD POVERTY UNDER THE AGE OF 16
6.9/ 100
METRIC RATING
210th/ 347
METRIC RANK
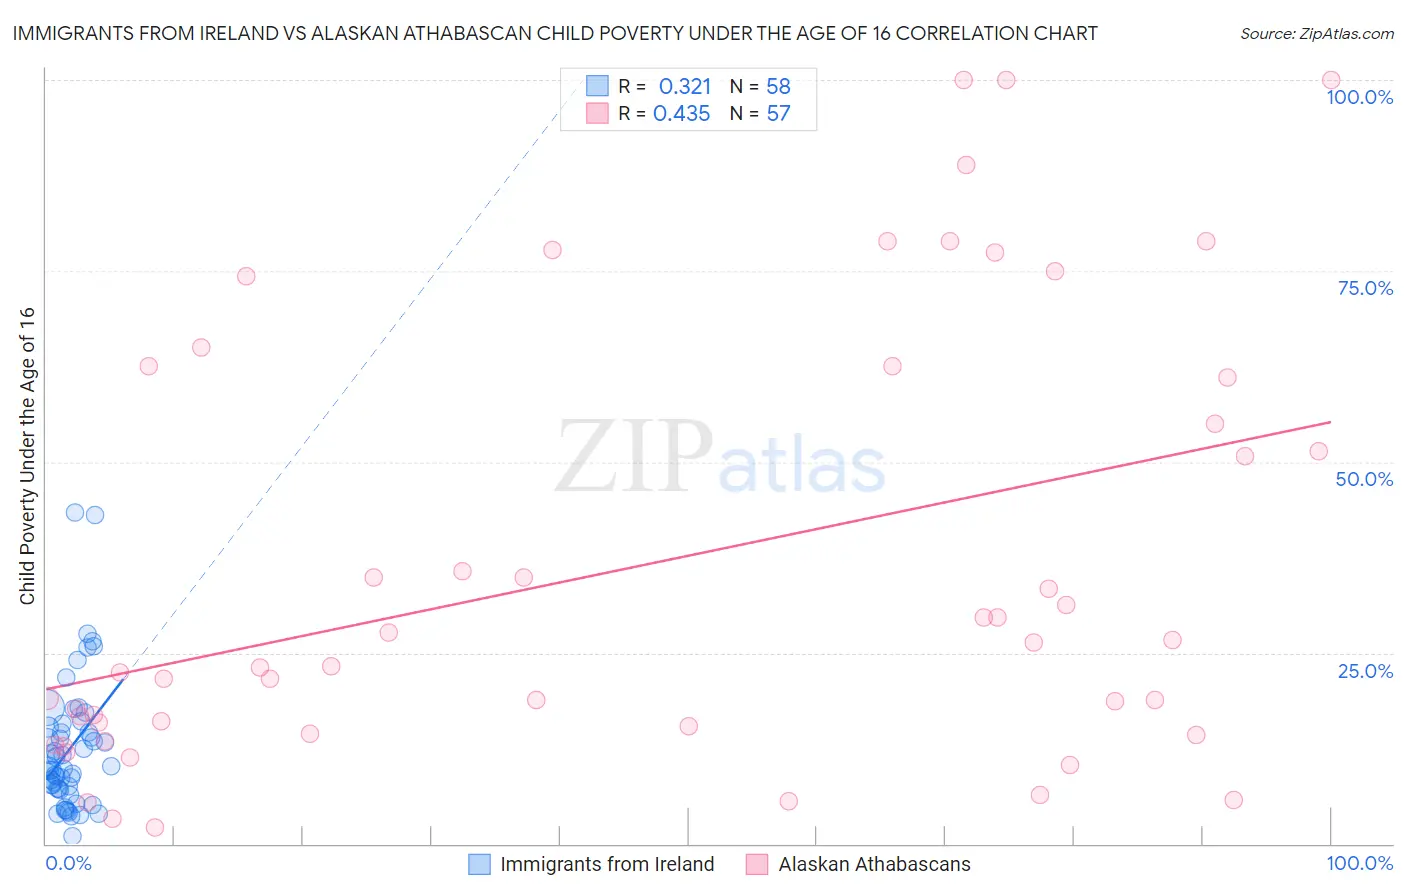
Immigrants from Ireland vs Alaskan Athabascan Child Poverty Under the Age of 16 Correlation Chart
The statistical analysis conducted on geographies consisting of 238,601,869 people shows a mild positive correlation between the proportion of Immigrants from Ireland and poverty level among children under the age of 16 in the United States with a correlation coefficient (R) of 0.321 and weighted average of 12.7%. Similarly, the statistical analysis conducted on geographies consisting of 45,725,386 people shows a moderate positive correlation between the proportion of Alaskan Athabascans and poverty level among children under the age of 16 in the United States with a correlation coefficient (R) of 0.435 and weighted average of 17.5%, a difference of 37.9%.
Child Poverty Under the Age of 16 Correlation Summary
| Measurement | Immigrants from Ireland | Alaskan Athabascan |
| Minimum | 0.95% | 2.1% |
| Maximum | 43.3% | 100.0% |
| Range | 42.4% | 97.9% |
| Mean | 12.4% | 36.2% |
| Median | 9.9% | 23.2% |
| Interquartile 25% (IQ1) | 7.2% | 14.9% |
| Interquartile 75% (IQ3) | 15.3% | 61.8% |
| Interquartile Range (IQR) | 8.1% | 46.9% |
| Standard Deviation (Sample) | 8.6% | 28.6% |
| Standard Deviation (Population) | 8.5% | 28.3% |
Similar Demographics by Child Poverty Under the Age of 16
Demographics Similar to Immigrants from Ireland by Child Poverty Under the Age of 16
In terms of child poverty under the age of 16, the demographic groups most similar to Immigrants from Ireland are Burmese (12.8%, a difference of 1.1%), Bhutanese (12.5%, a difference of 1.1%), Immigrants from South Central Asia (12.5%, a difference of 1.1%), Immigrants from Lithuania (12.9%, a difference of 1.9%), and Immigrants from Korea (13.0%, a difference of 2.3%).
| Demographics | Rating | Rank | Child Poverty Under the Age of 16 |
| Chinese | 100.0 /100 | #5 | Exceptional 11.9% |
| Immigrants | Hong Kong | 100.0 /100 | #6 | Exceptional 12.1% |
| Iranians | 100.0 /100 | #7 | Exceptional 12.2% |
| Immigrants | Singapore | 100.0 /100 | #8 | Exceptional 12.4% |
| Immigrants | Iran | 100.0 /100 | #9 | Exceptional 12.4% |
| Immigrants | South Central Asia | 99.9 /100 | #10 | Exceptional 12.5% |
| Bhutanese | 99.9 /100 | #11 | Exceptional 12.5% |
| Immigrants | Ireland | 99.9 /100 | #12 | Exceptional 12.7% |
| Burmese | 99.9 /100 | #13 | Exceptional 12.8% |
| Immigrants | Lithuania | 99.9 /100 | #14 | Exceptional 12.9% |
| Immigrants | Korea | 99.9 /100 | #15 | Exceptional 13.0% |
| Norwegians | 99.9 /100 | #16 | Exceptional 13.0% |
| Bulgarians | 99.9 /100 | #17 | Exceptional 13.0% |
| Cypriots | 99.9 /100 | #18 | Exceptional 13.0% |
| Immigrants | Japan | 99.8 /100 | #19 | Exceptional 13.0% |
Demographics Similar to Alaskan Athabascans by Child Poverty Under the Age of 16
In terms of child poverty under the age of 16, the demographic groups most similar to Alaskan Athabascans are Panamanian (17.5%, a difference of 0.010%), Immigrants from Thailand (17.5%, a difference of 0.12%), Immigrants (17.5%, a difference of 0.15%), Pennsylvania German (17.4%, a difference of 0.27%), and Immigrants from the Azores (17.5%, a difference of 0.32%).
| Demographics | Rating | Rank | Child Poverty Under the Age of 16 |
| Immigrants | Sierra Leone | 14.2 /100 | #203 | Poor 17.1% |
| Hmong | 14.0 /100 | #204 | Poor 17.1% |
| Aleuts | 13.9 /100 | #205 | Poor 17.1% |
| Alaska Natives | 11.8 /100 | #206 | Poor 17.2% |
| German Russians | 8.6 /100 | #207 | Tragic 17.4% |
| Pennsylvania Germans | 7.5 /100 | #208 | Tragic 17.4% |
| Panamanians | 6.9 /100 | #209 | Tragic 17.5% |
| Alaskan Athabascans | 6.9 /100 | #210 | Tragic 17.5% |
| Immigrants | Thailand | 6.6 /100 | #211 | Tragic 17.5% |
| Immigrants | Immigrants | 6.5 /100 | #212 | Tragic 17.5% |
| Immigrants | Azores | 6.2 /100 | #213 | Tragic 17.5% |
| Iraqis | 5.9 /100 | #214 | Tragic 17.5% |
| Malaysians | 5.9 /100 | #215 | Tragic 17.5% |
| Sierra Leoneans | 5.7 /100 | #216 | Tragic 17.6% |
| Immigrants | Eastern Africa | 5.3 /100 | #217 | Tragic 17.6% |