Immigrants from Iraq vs Immigrants from Lithuania Female Poverty Among 18-24 Year Olds
COMPARE
Immigrants from Iraq
Immigrants from Lithuania
Female Poverty Among 18-24 Year Olds
Female Poverty Among 18-24 Year Olds Comparison
Immigrants from Iraq
Immigrants from Lithuania
18.9%
FEMALE POVERTY AMONG 18-24 YEAR OLDS
99.2/ 100
METRIC RATING
86th/ 347
METRIC RANK
17.4%
FEMALE POVERTY AMONG 18-24 YEAR OLDS
100.0/ 100
METRIC RATING
19th/ 347
METRIC RANK
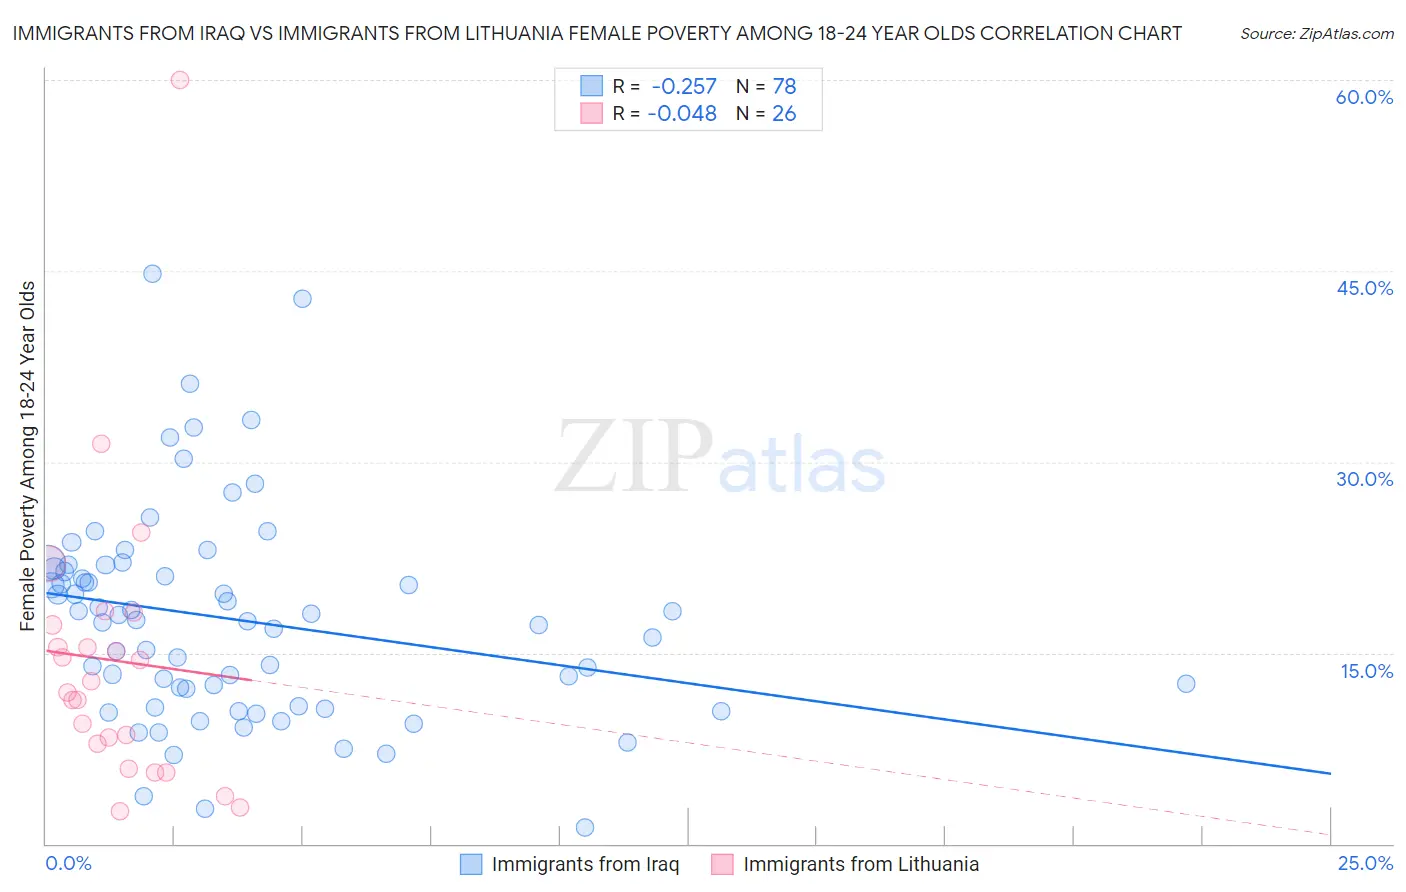
Immigrants from Iraq vs Immigrants from Lithuania Female Poverty Among 18-24 Year Olds Correlation Chart
The statistical analysis conducted on geographies consisting of 193,059,376 people shows a weak negative correlation between the proportion of Immigrants from Iraq and poverty level among females between the ages 18 and 24 in the United States with a correlation coefficient (R) of -0.257 and weighted average of 18.9%. Similarly, the statistical analysis conducted on geographies consisting of 116,192,815 people shows no correlation between the proportion of Immigrants from Lithuania and poverty level among females between the ages 18 and 24 in the United States with a correlation coefficient (R) of -0.048 and weighted average of 17.4%, a difference of 8.7%.
Female Poverty Among 18-24 Year Olds Correlation Summary
| Measurement | Immigrants from Iraq | Immigrants from Lithuania |
| Minimum | 1.3% | 2.6% |
| Maximum | 44.8% | 60.0% |
| Range | 43.5% | 57.4% |
| Mean | 17.6% | 14.4% |
| Median | 17.5% | 12.3% |
| Interquartile 25% (IQ1) | 10.8% | 7.8% |
| Interquartile 75% (IQ3) | 21.6% | 17.2% |
| Interquartile Range (IQR) | 10.8% | 9.3% |
| Standard Deviation (Sample) | 8.3% | 11.6% |
| Standard Deviation (Population) | 8.3% | 11.3% |
Similar Demographics by Female Poverty Among 18-24 Year Olds
Demographics Similar to Immigrants from Iraq by Female Poverty Among 18-24 Year Olds
In terms of female poverty among 18-24 year olds, the demographic groups most similar to Immigrants from Iraq are Immigrants from Jamaica (18.9%, a difference of 0.010%), Immigrants from Armenia (18.9%, a difference of 0.070%), Burmese (18.9%, a difference of 0.11%), Croatian (19.0%, a difference of 0.16%), and Immigrants from Cabo Verde (19.0%, a difference of 0.18%).
| Demographics | Rating | Rank | Female Poverty Among 18-24 Year Olds |
| Uruguayans | 99.5 /100 | #79 | Exceptional 18.8% |
| Palestinians | 99.5 /100 | #80 | Exceptional 18.8% |
| Japanese | 99.5 /100 | #81 | Exceptional 18.8% |
| Immigrants | Uruguay | 99.4 /100 | #82 | Exceptional 18.8% |
| Immigrants | Indonesia | 99.4 /100 | #83 | Exceptional 18.9% |
| Burmese | 99.2 /100 | #84 | Exceptional 18.9% |
| Immigrants | Armenia | 99.2 /100 | #85 | Exceptional 18.9% |
| Immigrants | Iraq | 99.2 /100 | #86 | Exceptional 18.9% |
| Immigrants | Jamaica | 99.2 /100 | #87 | Exceptional 18.9% |
| Croatians | 99.1 /100 | #88 | Exceptional 19.0% |
| Immigrants | Cabo Verde | 99.0 /100 | #89 | Exceptional 19.0% |
| Afghans | 99.0 /100 | #90 | Exceptional 19.0% |
| Romanians | 98.9 /100 | #91 | Exceptional 19.0% |
| Filipinos | 98.9 /100 | #92 | Exceptional 19.0% |
| Haitians | 98.9 /100 | #93 | Exceptional 19.0% |
Demographics Similar to Immigrants from Lithuania by Female Poverty Among 18-24 Year Olds
In terms of female poverty among 18-24 year olds, the demographic groups most similar to Immigrants from Lithuania are Immigrants from Venezuela (17.4%, a difference of 0.13%), Bolivian (17.4%, a difference of 0.13%), Immigrants from Hong Kong (17.5%, a difference of 0.23%), Immigrants from Colombia (17.3%, a difference of 0.41%), and Immigrants from North Macedonia (17.6%, a difference of 0.80%).
| Demographics | Rating | Rank | Female Poverty Among 18-24 Year Olds |
| Immigrants | Pakistan | 100.0 /100 | #12 | Exceptional 17.0% |
| Immigrants | Poland | 100.0 /100 | #13 | Exceptional 17.1% |
| Tongans | 100.0 /100 | #14 | Exceptional 17.1% |
| Cubans | 100.0 /100 | #15 | Exceptional 17.2% |
| Peruvians | 100.0 /100 | #16 | Exceptional 17.2% |
| Immigrants | Taiwan | 100.0 /100 | #17 | Exceptional 17.3% |
| Immigrants | Colombia | 100.0 /100 | #18 | Exceptional 17.3% |
| Immigrants | Lithuania | 100.0 /100 | #19 | Exceptional 17.4% |
| Immigrants | Venezuela | 100.0 /100 | #20 | Exceptional 17.4% |
| Bolivians | 100.0 /100 | #21 | Exceptional 17.4% |
| Immigrants | Hong Kong | 100.0 /100 | #22 | Exceptional 17.5% |
| Immigrants | North Macedonia | 100.0 /100 | #23 | Exceptional 17.6% |
| Maltese | 100.0 /100 | #24 | Exceptional 17.6% |
| Immigrants | South Central Asia | 100.0 /100 | #25 | Exceptional 17.6% |
| Immigrants | Fiji | 100.0 /100 | #26 | Exceptional 17.7% |