Immigrants from Haiti vs Creek Seniors Poverty Over the Age of 75
COMPARE
Immigrants from Haiti
Creek
Seniors Poverty Over the Age of 75
Seniors Poverty Over the Age of 75 Comparison
Immigrants from Haiti
Creek
16.5%
SENIORS POVERTY OVER THE AGE OF 75
0.0/ 100
METRIC RATING
321st/ 347
METRIC RANK
11.6%
SENIORS POVERTY OVER THE AGE OF 75
92.7/ 100
METRIC RATING
94th/ 347
METRIC RANK
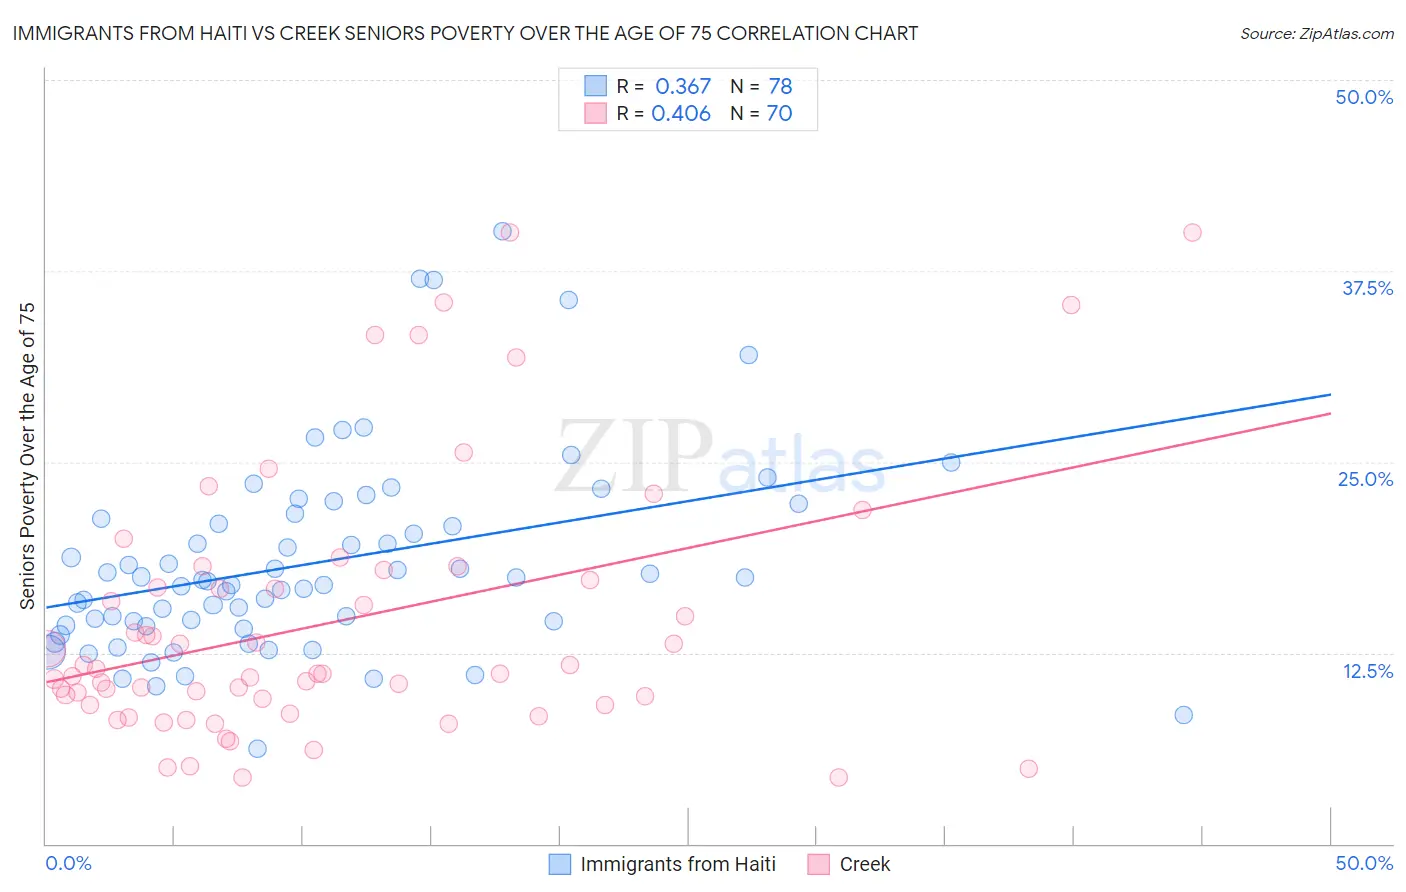
Immigrants from Haiti vs Creek Seniors Poverty Over the Age of 75 Correlation Chart
The statistical analysis conducted on geographies consisting of 223,608,368 people shows a mild positive correlation between the proportion of Immigrants from Haiti and poverty level among seniors over the age of 75 in the United States with a correlation coefficient (R) of 0.367 and weighted average of 16.5%. Similarly, the statistical analysis conducted on geographies consisting of 177,296,748 people shows a moderate positive correlation between the proportion of Creek and poverty level among seniors over the age of 75 in the United States with a correlation coefficient (R) of 0.406 and weighted average of 11.6%, a difference of 42.9%.
Seniors Poverty Over the Age of 75 Correlation Summary
| Measurement | Immigrants from Haiti | Creek |
| Minimum | 6.2% | 4.3% |
| Maximum | 40.1% | 40.0% |
| Range | 33.9% | 35.7% |
| Mean | 18.4% | 14.5% |
| Median | 17.2% | 11.1% |
| Interquartile 25% (IQ1) | 14.3% | 9.1% |
| Interquartile 75% (IQ3) | 21.2% | 17.2% |
| Interquartile Range (IQR) | 6.9% | 8.1% |
| Standard Deviation (Sample) | 6.5% | 8.6% |
| Standard Deviation (Population) | 6.4% | 8.5% |
Similar Demographics by Seniors Poverty Over the Age of 75
Demographics Similar to Immigrants from Haiti by Seniors Poverty Over the Age of 75
In terms of seniors poverty over the age of 75, the demographic groups most similar to Immigrants from Haiti are Immigrants from Barbados (16.5%, a difference of 0.020%), Central American Indian (16.5%, a difference of 0.11%), Immigrants from Uzbekistan (16.5%, a difference of 0.16%), Immigrants from Yemen (16.5%, a difference of 0.18%), and Nicaraguan (16.6%, a difference of 0.55%).
| Demographics | Rating | Rank | Seniors Poverty Over the Age of 75 |
| Tsimshian | 0.0 /100 | #314 | Tragic 16.1% |
| Guyanese | 0.0 /100 | #315 | Tragic 16.1% |
| Immigrants | Ecuador | 0.0 /100 | #316 | Tragic 16.1% |
| Immigrants | Guyana | 0.0 /100 | #317 | Tragic 16.2% |
| Houma | 0.0 /100 | #318 | Tragic 16.2% |
| Haitians | 0.0 /100 | #319 | Tragic 16.2% |
| Immigrants | Yemen | 0.0 /100 | #320 | Tragic 16.5% |
| Immigrants | Haiti | 0.0 /100 | #321 | Tragic 16.5% |
| Immigrants | Barbados | 0.0 /100 | #322 | Tragic 16.5% |
| Central American Indians | 0.0 /100 | #323 | Tragic 16.5% |
| Immigrants | Uzbekistan | 0.0 /100 | #324 | Tragic 16.5% |
| Nicaraguans | 0.0 /100 | #325 | Tragic 16.6% |
| Pueblo | 0.0 /100 | #326 | Tragic 16.7% |
| Sioux | 0.0 /100 | #327 | Tragic 16.8% |
| Cape Verdeans | 0.0 /100 | #328 | Tragic 16.8% |
Demographics Similar to Creek by Seniors Poverty Over the Age of 75
In terms of seniors poverty over the age of 75, the demographic groups most similar to Creek are Immigrants from Bosnia and Herzegovina (11.6%, a difference of 0.040%), Immigrants from Sweden (11.6%, a difference of 0.040%), Immigrants from Poland (11.6%, a difference of 0.050%), Romanian (11.6%, a difference of 0.13%), and Immigrants from Japan (11.6%, a difference of 0.24%).
| Demographics | Rating | Rank | Seniors Poverty Over the Age of 75 |
| Koreans | 94.5 /100 | #87 | Exceptional 11.5% |
| Immigrants | Croatia | 94.5 /100 | #88 | Exceptional 11.5% |
| Immigrants | Sri Lanka | 94.4 /100 | #89 | Exceptional 11.5% |
| Aleuts | 94.1 /100 | #90 | Exceptional 11.5% |
| Immigrants | Germany | 94.1 /100 | #91 | Exceptional 11.5% |
| Kenyans | 93.9 /100 | #92 | Exceptional 11.5% |
| Immigrants | Poland | 92.9 /100 | #93 | Exceptional 11.6% |
| Creek | 92.7 /100 | #94 | Exceptional 11.6% |
| Immigrants | Bosnia and Herzegovina | 92.6 /100 | #95 | Exceptional 11.6% |
| Immigrants | Sweden | 92.6 /100 | #96 | Exceptional 11.6% |
| Romanians | 92.3 /100 | #97 | Exceptional 11.6% |
| Immigrants | Japan | 91.9 /100 | #98 | Exceptional 11.6% |
| Immigrants | Ethiopia | 91.7 /100 | #99 | Exceptional 11.6% |
| Syrians | 91.1 /100 | #100 | Exceptional 11.6% |
| Jordanians | 90.8 /100 | #101 | Exceptional 11.6% |