Immigrants from Guatemala vs Immigrants from Western Europe Child Poverty Under the Age of 16
COMPARE
Immigrants from Guatemala
Immigrants from Western Europe
Child Poverty Under the Age of 16
Child Poverty Under the Age of 16 Comparison
Immigrants from Guatemala
Immigrants from Western Europe
21.6%
CHILD POVERTY UNDER THE AGE OF 16
0.0/ 100
METRIC RATING
315th/ 347
METRIC RANK
15.1%
CHILD POVERTY UNDER THE AGE OF 16
90.3/ 100
METRIC RATING
127th/ 347
METRIC RANK
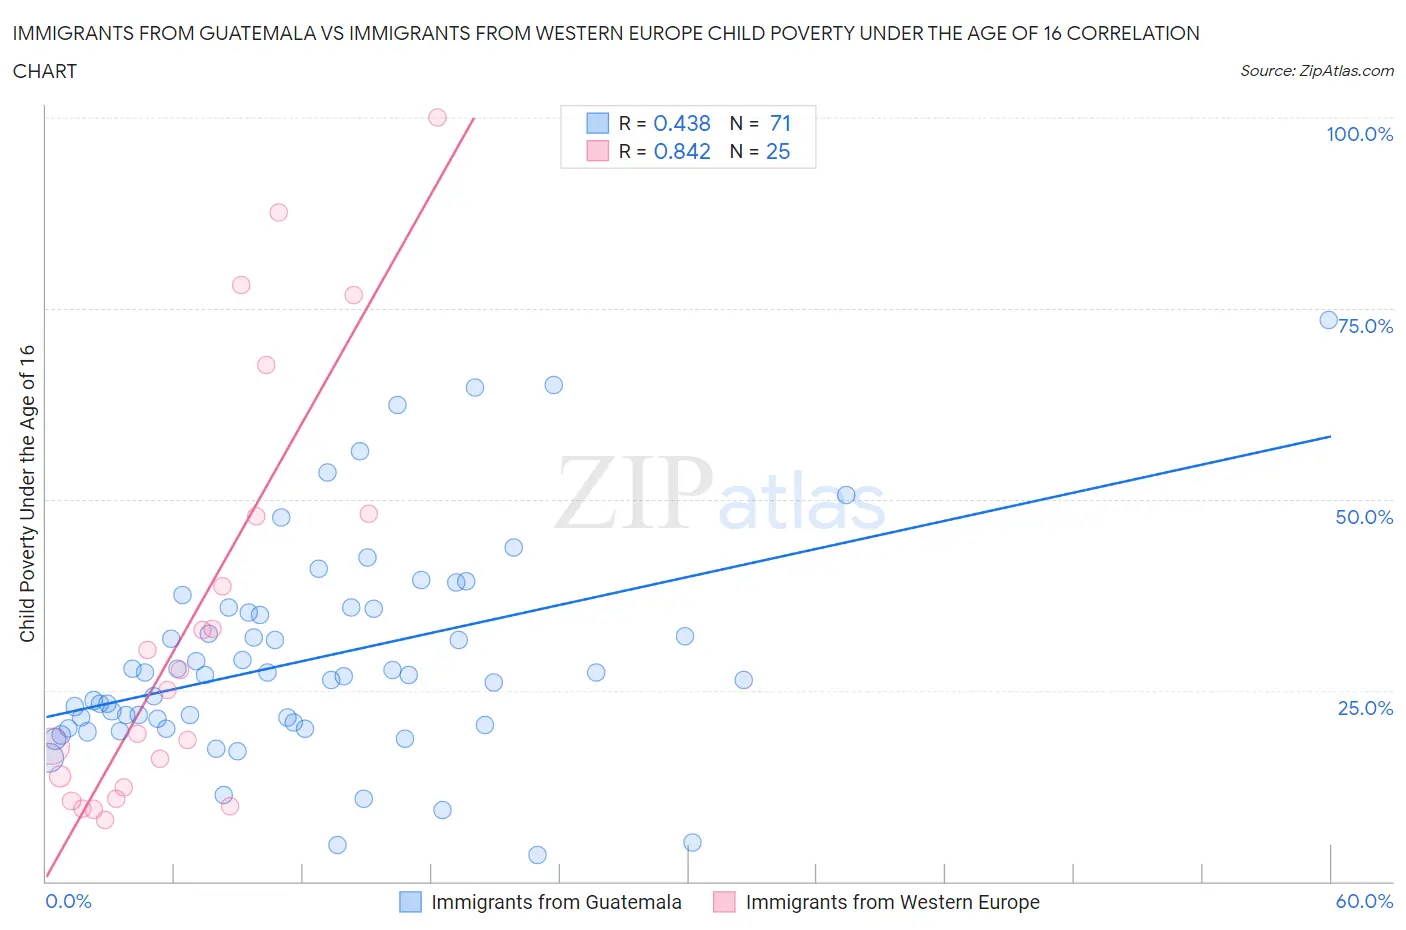
Immigrants from Guatemala vs Immigrants from Western Europe Child Poverty Under the Age of 16 Correlation Chart
The statistical analysis conducted on geographies consisting of 375,394,952 people shows a moderate positive correlation between the proportion of Immigrants from Guatemala and poverty level among children under the age of 16 in the United States with a correlation coefficient (R) of 0.438 and weighted average of 21.6%. Similarly, the statistical analysis conducted on geographies consisting of 486,953,349 people shows a very strong positive correlation between the proportion of Immigrants from Western Europe and poverty level among children under the age of 16 in the United States with a correlation coefficient (R) of 0.842 and weighted average of 15.1%, a difference of 43.0%.
Child Poverty Under the Age of 16 Correlation Summary
| Measurement | Immigrants from Guatemala | Immigrants from Western Europe |
| Minimum | 3.4% | 8.0% |
| Maximum | 73.5% | 100.0% |
| Range | 70.1% | 92.0% |
| Mean | 29.1% | 34.0% |
| Median | 27.1% | 25.1% |
| Interquartile 25% (IQ1) | 20.5% | 11.5% |
| Interquartile 75% (IQ3) | 35.7% | 47.9% |
| Interquartile Range (IQR) | 15.3% | 36.4% |
| Standard Deviation (Sample) | 14.0% | 27.5% |
| Standard Deviation (Population) | 13.9% | 26.9% |
Similar Demographics by Child Poverty Under the Age of 16
Demographics Similar to Immigrants from Guatemala by Child Poverty Under the Age of 16
In terms of child poverty under the age of 16, the demographic groups most similar to Immigrants from Guatemala are Immigrants from Somalia (21.6%, a difference of 0.14%), Creek (21.5%, a difference of 0.34%), Ute (21.5%, a difference of 0.37%), African (21.7%, a difference of 0.42%), and Dutch West Indian (21.5%, a difference of 0.62%).
| Demographics | Rating | Rank | Child Poverty Under the Age of 16 |
| British West Indians | 0.0 /100 | #308 | Tragic 21.3% |
| Immigrants | Mexico | 0.0 /100 | #309 | Tragic 21.5% |
| Bahamians | 0.0 /100 | #310 | Tragic 21.5% |
| Dutch West Indians | 0.0 /100 | #311 | Tragic 21.5% |
| Ute | 0.0 /100 | #312 | Tragic 21.5% |
| Creek | 0.0 /100 | #313 | Tragic 21.5% |
| Immigrants | Somalia | 0.0 /100 | #314 | Tragic 21.6% |
| Immigrants | Guatemala | 0.0 /100 | #315 | Tragic 21.6% |
| Africans | 0.0 /100 | #316 | Tragic 21.7% |
| Immigrants | Dominica | 0.0 /100 | #317 | Tragic 21.9% |
| U.S. Virgin Islanders | 0.0 /100 | #318 | Tragic 22.0% |
| Yakama | 0.0 /100 | #319 | Tragic 22.1% |
| Cajuns | 0.0 /100 | #320 | Tragic 22.1% |
| Kiowa | 0.0 /100 | #321 | Tragic 22.2% |
| Hondurans | 0.0 /100 | #322 | Tragic 22.2% |
Demographics Similar to Immigrants from Western Europe by Child Poverty Under the Age of 16
In terms of child poverty under the age of 16, the demographic groups most similar to Immigrants from Western Europe are Immigrants from Kazakhstan (15.1%, a difference of 0.060%), Portuguese (15.1%, a difference of 0.090%), Immigrants from Southern Europe (15.1%, a difference of 0.21%), Palestinian (15.1%, a difference of 0.23%), and Czechoslovakian (15.1%, a difference of 0.27%).
| Demographics | Rating | Rank | Child Poverty Under the Age of 16 |
| South Africans | 92.1 /100 | #120 | Exceptional 15.0% |
| Immigrants | Zimbabwe | 92.1 /100 | #121 | Exceptional 15.0% |
| Pakistanis | 91.7 /100 | #122 | Exceptional 15.0% |
| Immigrants | Brazil | 91.1 /100 | #123 | Exceptional 15.1% |
| Czechoslovakians | 91.0 /100 | #124 | Exceptional 15.1% |
| Palestinians | 90.9 /100 | #125 | Exceptional 15.1% |
| Portuguese | 90.6 /100 | #126 | Exceptional 15.1% |
| Immigrants | Western Europe | 90.3 /100 | #127 | Exceptional 15.1% |
| Immigrants | Kazakhstan | 90.2 /100 | #128 | Exceptional 15.1% |
| Immigrants | Southern Europe | 89.7 /100 | #129 | Excellent 15.1% |
| Mongolians | 89.5 /100 | #130 | Excellent 15.2% |
| Armenians | 89.4 /100 | #131 | Excellent 15.2% |
| Canadians | 89.1 /100 | #132 | Excellent 15.2% |
| Immigrants | South Eastern Asia | 89.0 /100 | #133 | Excellent 15.2% |
| Native Hawaiians | 88.7 /100 | #134 | Excellent 15.2% |