Immigrants from Grenada vs Immigrants from Dominican Republic Single Male Poverty
COMPARE
Immigrants from Grenada
Immigrants from Dominican Republic
Single Male Poverty
Single Male Poverty Comparison
Immigrants from Grenada
Immigrants from Dominican Republic
13.0%
SINGLE MALE POVERTY
23.1/ 100
METRIC RATING
196th/ 347
METRIC RANK
14.8%
SINGLE MALE POVERTY
0.0/ 100
METRIC RATING
297th/ 347
METRIC RANK
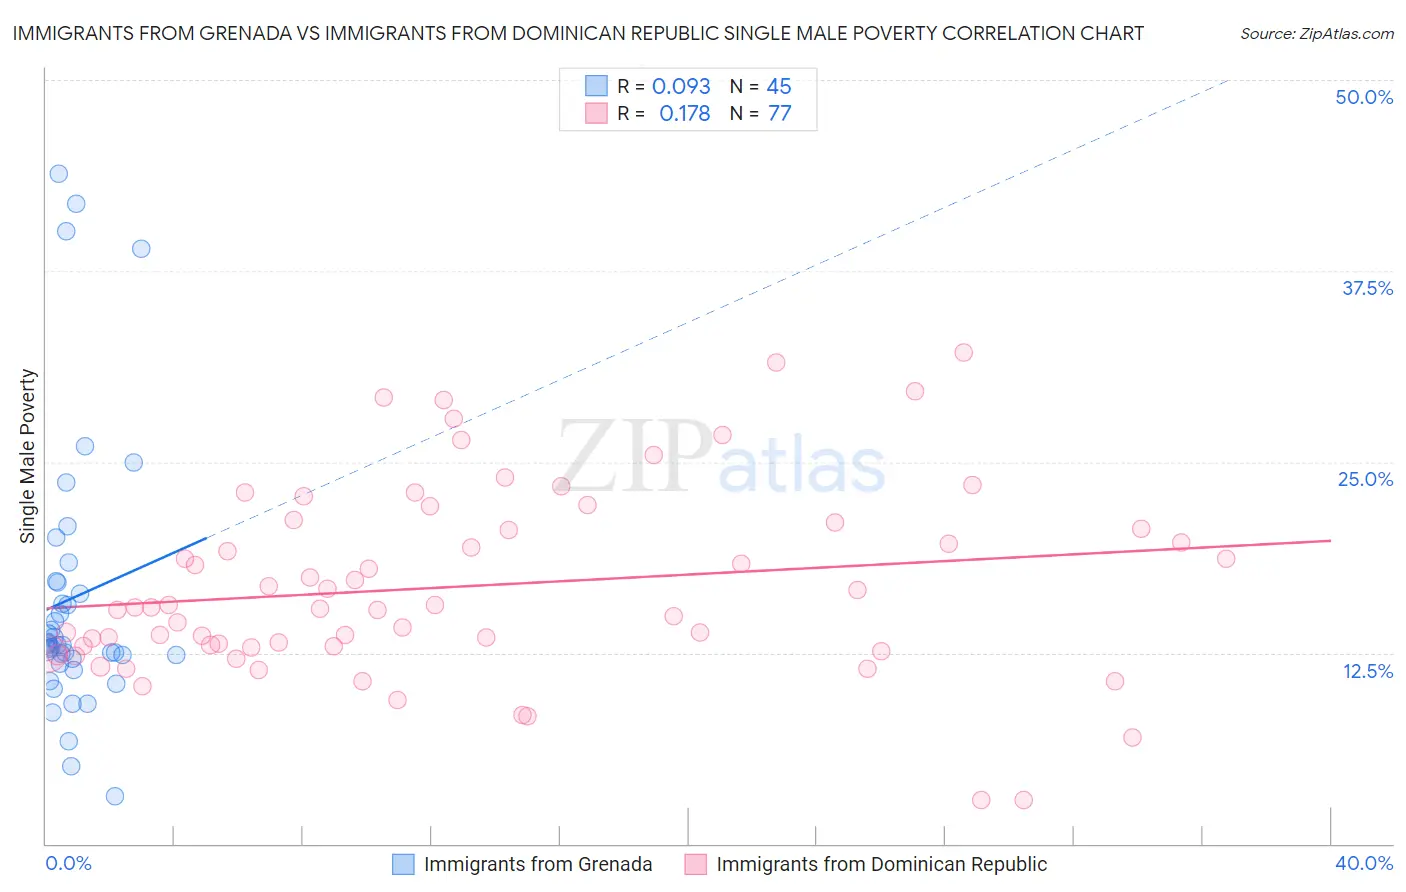
Immigrants from Grenada vs Immigrants from Dominican Republic Single Male Poverty Correlation Chart
The statistical analysis conducted on geographies consisting of 65,217,109 people shows a slight positive correlation between the proportion of Immigrants from Grenada and poverty level among single males in the United States with a correlation coefficient (R) of 0.093 and weighted average of 13.0%. Similarly, the statistical analysis conducted on geographies consisting of 249,403,835 people shows a poor positive correlation between the proportion of Immigrants from Dominican Republic and poverty level among single males in the United States with a correlation coefficient (R) of 0.178 and weighted average of 14.8%, a difference of 13.7%.
Single Male Poverty Correlation Summary
| Measurement | Immigrants from Grenada | Immigrants from Dominican Republic |
| Minimum | 3.1% | 2.9% |
| Maximum | 43.9% | 32.2% |
| Range | 40.7% | 29.3% |
| Mean | 16.1% | 16.8% |
| Median | 13.0% | 15.4% |
| Interquartile 25% (IQ1) | 11.9% | 12.9% |
| Interquartile 75% (IQ3) | 17.2% | 20.8% |
| Interquartile Range (IQR) | 5.2% | 7.9% |
| Standard Deviation (Sample) | 9.1% | 6.2% |
| Standard Deviation (Population) | 9.0% | 6.2% |
Similar Demographics by Single Male Poverty
Demographics Similar to Immigrants from Grenada by Single Male Poverty
In terms of single male poverty, the demographic groups most similar to Immigrants from Grenada are Immigrants from Laos (13.0%, a difference of 0.0%), Immigrants from England (13.0%, a difference of 0.020%), Lithuanian (13.0%, a difference of 0.080%), Immigrants from Norway (13.0%, a difference of 0.10%), and Slovene (13.0%, a difference of 0.12%).
| Demographics | Rating | Rank | Single Male Poverty |
| Portuguese | 30.2 /100 | #189 | Fair 12.9% |
| Arabs | 27.0 /100 | #190 | Fair 13.0% |
| Immigrants | Thailand | 26.6 /100 | #191 | Fair 13.0% |
| Immigrants | Jamaica | 26.5 /100 | #192 | Fair 13.0% |
| Immigrants | South Africa | 26.1 /100 | #193 | Fair 13.0% |
| Liberians | 25.2 /100 | #194 | Fair 13.0% |
| Immigrants | England | 23.4 /100 | #195 | Fair 13.0% |
| Immigrants | Grenada | 23.1 /100 | #196 | Fair 13.0% |
| Immigrants | Laos | 23.1 /100 | #197 | Fair 13.0% |
| Lithuanians | 22.1 /100 | #198 | Fair 13.0% |
| Immigrants | Norway | 21.8 /100 | #199 | Fair 13.0% |
| Slovenes | 21.6 /100 | #200 | Fair 13.0% |
| Trinidadians and Tobagonians | 21.4 /100 | #201 | Fair 13.0% |
| Basques | 20.7 /100 | #202 | Fair 13.0% |
| Immigrants | Bangladesh | 20.4 /100 | #203 | Fair 13.0% |
Demographics Similar to Immigrants from Dominican Republic by Single Male Poverty
In terms of single male poverty, the demographic groups most similar to Immigrants from Dominican Republic are African (14.7%, a difference of 0.35%), Scotch-Irish (14.7%, a difference of 0.67%), Ottawa (14.6%, a difference of 1.1%), French American Indian (15.0%, a difference of 1.3%), and French Canadian (14.6%, a difference of 1.3%).
| Demographics | Rating | Rank | Single Male Poverty |
| U.S. Virgin Islanders | 0.0 /100 | #290 | Tragic 14.5% |
| Bahamians | 0.0 /100 | #291 | Tragic 14.6% |
| Immigrants | Nonimmigrants | 0.0 /100 | #292 | Tragic 14.6% |
| French Canadians | 0.0 /100 | #293 | Tragic 14.6% |
| Ottawa | 0.0 /100 | #294 | Tragic 14.6% |
| Scotch-Irish | 0.0 /100 | #295 | Tragic 14.7% |
| Africans | 0.0 /100 | #296 | Tragic 14.7% |
| Immigrants | Dominican Republic | 0.0 /100 | #297 | Tragic 14.8% |
| French American Indians | 0.0 /100 | #298 | Tragic 15.0% |
| Delaware | 0.0 /100 | #299 | Tragic 15.0% |
| Cree | 0.0 /100 | #300 | Tragic 15.1% |
| Dominicans | 0.0 /100 | #301 | Tragic 15.2% |
| Alsatians | 0.0 /100 | #302 | Tragic 15.2% |
| Aleuts | 0.0 /100 | #303 | Tragic 15.4% |
| Alaska Natives | 0.0 /100 | #304 | Tragic 15.4% |