Immigrants from Central America vs Immigrants from Dominican Republic Single Male Poverty
COMPARE
Immigrants from Central America
Immigrants from Dominican Republic
Single Male Poverty
Single Male Poverty Comparison
Immigrants from Central America
Immigrants from Dominican Republic
13.8%
SINGLE MALE POVERTY
0.3/ 100
METRIC RATING
257th/ 347
METRIC RANK
14.8%
SINGLE MALE POVERTY
0.0/ 100
METRIC RATING
297th/ 347
METRIC RANK
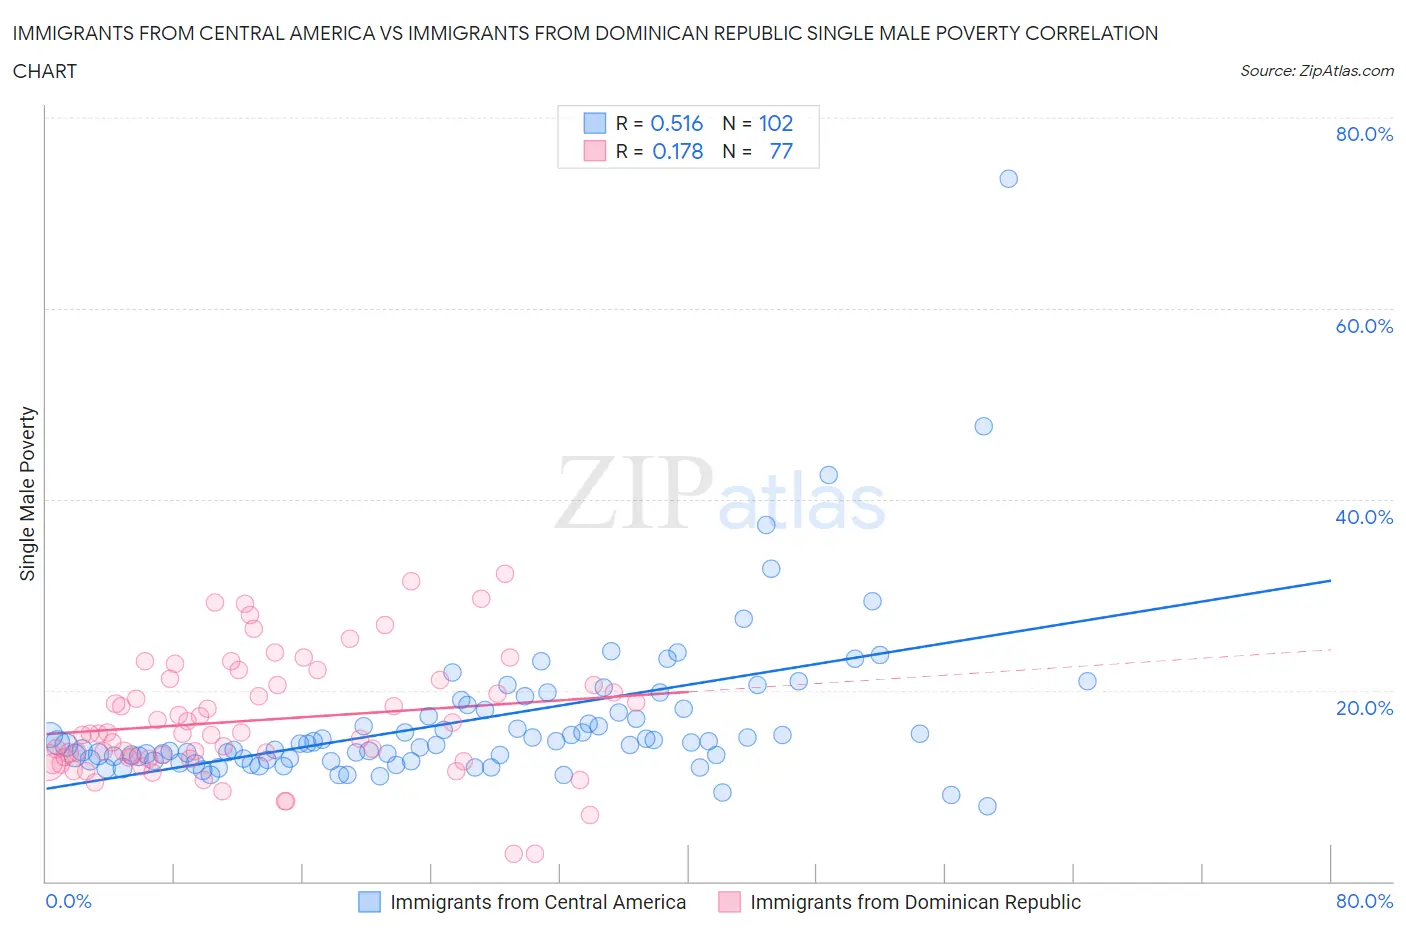
Immigrants from Central America vs Immigrants from Dominican Republic Single Male Poverty Correlation Chart
The statistical analysis conducted on geographies consisting of 454,315,872 people shows a substantial positive correlation between the proportion of Immigrants from Central America and poverty level among single males in the United States with a correlation coefficient (R) of 0.516 and weighted average of 13.8%. Similarly, the statistical analysis conducted on geographies consisting of 249,403,835 people shows a poor positive correlation between the proportion of Immigrants from Dominican Republic and poverty level among single males in the United States with a correlation coefficient (R) of 0.178 and weighted average of 14.8%, a difference of 7.5%.
Single Male Poverty Correlation Summary
| Measurement | Immigrants from Central America | Immigrants from Dominican Republic |
| Minimum | 7.9% | 2.9% |
| Maximum | 73.6% | 32.2% |
| Range | 65.7% | 29.3% |
| Mean | 16.8% | 16.8% |
| Median | 14.4% | 15.4% |
| Interquartile 25% (IQ1) | 12.7% | 12.9% |
| Interquartile 75% (IQ3) | 17.9% | 20.8% |
| Interquartile Range (IQR) | 5.2% | 7.9% |
| Standard Deviation (Sample) | 8.5% | 6.2% |
| Standard Deviation (Population) | 8.5% | 6.2% |
Similar Demographics by Single Male Poverty
Demographics Similar to Immigrants from Central America by Single Male Poverty
In terms of single male poverty, the demographic groups most similar to Immigrants from Central America are Immigrants from Guatemala (13.8%, a difference of 0.070%), Guatemalan (13.8%, a difference of 0.11%), Immigrants from Belize (13.7%, a difference of 0.18%), Swiss (13.8%, a difference of 0.18%), and Hungarian (13.8%, a difference of 0.23%).
| Demographics | Rating | Rank | Single Male Poverty |
| Immigrants | Somalia | 1.0 /100 | #250 | Tragic 13.6% |
| Immigrants | Zaire | 0.9 /100 | #251 | Tragic 13.6% |
| Finns | 0.9 /100 | #252 | Tragic 13.6% |
| German Russians | 0.8 /100 | #253 | Tragic 13.6% |
| Sub-Saharan Africans | 0.5 /100 | #254 | Tragic 13.7% |
| Spaniards | 0.4 /100 | #255 | Tragic 13.7% |
| Immigrants | Belize | 0.4 /100 | #256 | Tragic 13.7% |
| Immigrants | Central America | 0.3 /100 | #257 | Tragic 13.8% |
| Immigrants | Guatemala | 0.3 /100 | #258 | Tragic 13.8% |
| Guatemalans | 0.3 /100 | #259 | Tragic 13.8% |
| Swiss | 0.3 /100 | #260 | Tragic 13.8% |
| Hungarians | 0.3 /100 | #261 | Tragic 13.8% |
| Fijians | 0.3 /100 | #262 | Tragic 13.8% |
| Cape Verdeans | 0.2 /100 | #263 | Tragic 13.8% |
| West Indians | 0.2 /100 | #264 | Tragic 13.8% |
Demographics Similar to Immigrants from Dominican Republic by Single Male Poverty
In terms of single male poverty, the demographic groups most similar to Immigrants from Dominican Republic are African (14.7%, a difference of 0.35%), Scotch-Irish (14.7%, a difference of 0.67%), Ottawa (14.6%, a difference of 1.1%), French American Indian (15.0%, a difference of 1.3%), and French Canadian (14.6%, a difference of 1.3%).
| Demographics | Rating | Rank | Single Male Poverty |
| U.S. Virgin Islanders | 0.0 /100 | #290 | Tragic 14.5% |
| Bahamians | 0.0 /100 | #291 | Tragic 14.6% |
| Immigrants | Nonimmigrants | 0.0 /100 | #292 | Tragic 14.6% |
| French Canadians | 0.0 /100 | #293 | Tragic 14.6% |
| Ottawa | 0.0 /100 | #294 | Tragic 14.6% |
| Scotch-Irish | 0.0 /100 | #295 | Tragic 14.7% |
| Africans | 0.0 /100 | #296 | Tragic 14.7% |
| Immigrants | Dominican Republic | 0.0 /100 | #297 | Tragic 14.8% |
| French American Indians | 0.0 /100 | #298 | Tragic 15.0% |
| Delaware | 0.0 /100 | #299 | Tragic 15.0% |
| Cree | 0.0 /100 | #300 | Tragic 15.1% |
| Dominicans | 0.0 /100 | #301 | Tragic 15.2% |
| Alsatians | 0.0 /100 | #302 | Tragic 15.2% |
| Aleuts | 0.0 /100 | #303 | Tragic 15.4% |
| Alaska Natives | 0.0 /100 | #304 | Tragic 15.4% |