Immigrants from Grenada vs Immigrants from Croatia Seniors Poverty Over the Age of 75
COMPARE
Immigrants from Grenada
Immigrants from Croatia
Seniors Poverty Over the Age of 75
Seniors Poverty Over the Age of 75 Comparison
Immigrants from Grenada
Immigrants from Croatia
17.8%
SENIORS POVERTY OVER THE AGE OF 75
0.0/ 100
METRIC RATING
334th/ 347
METRIC RANK
11.5%
SENIORS POVERTY OVER THE AGE OF 75
94.5/ 100
METRIC RATING
88th/ 347
METRIC RANK
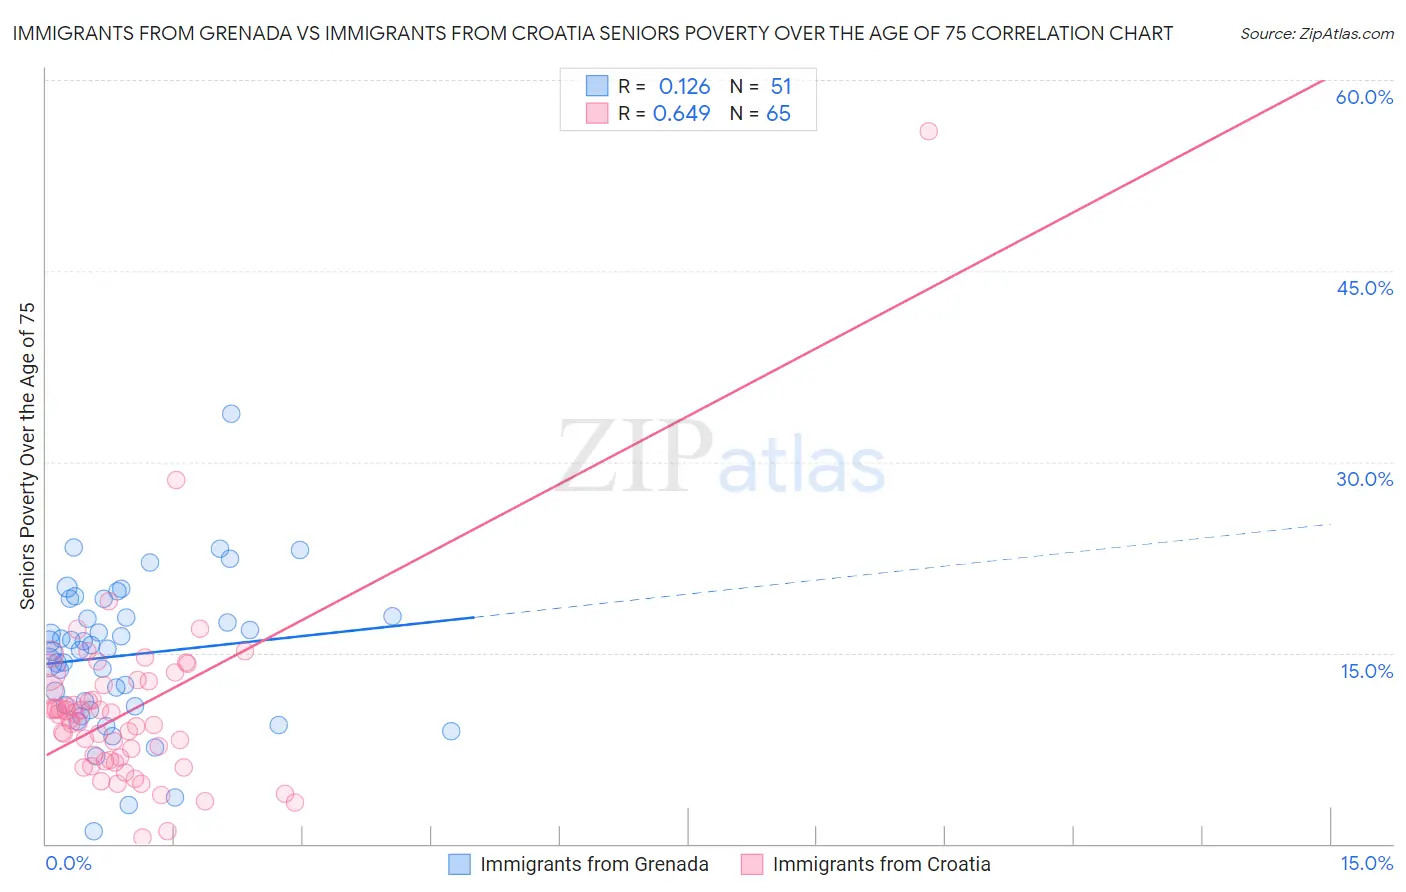
Immigrants from Grenada vs Immigrants from Croatia Seniors Poverty Over the Age of 75 Correlation Chart
The statistical analysis conducted on geographies consisting of 66,944,348 people shows a poor positive correlation between the proportion of Immigrants from Grenada and poverty level among seniors over the age of 75 in the United States with a correlation coefficient (R) of 0.126 and weighted average of 17.8%. Similarly, the statistical analysis conducted on geographies consisting of 132,096,620 people shows a significant positive correlation between the proportion of Immigrants from Croatia and poverty level among seniors over the age of 75 in the United States with a correlation coefficient (R) of 0.649 and weighted average of 11.5%, a difference of 55.4%.
Seniors Poverty Over the Age of 75 Correlation Summary
| Measurement | Immigrants from Grenada | Immigrants from Croatia |
| Minimum | 0.99% | 0.52% |
| Maximum | 33.8% | 56.0% |
| Range | 32.8% | 55.5% |
| Mean | 14.8% | 10.5% |
| Median | 15.3% | 9.7% |
| Interquartile 25% (IQ1) | 10.8% | 6.5% |
| Interquartile 75% (IQ3) | 17.8% | 12.6% |
| Interquartile Range (IQR) | 7.0% | 6.1% |
| Standard Deviation (Sample) | 5.9% | 7.3% |
| Standard Deviation (Population) | 5.8% | 7.3% |
Similar Demographics by Seniors Poverty Over the Age of 75
Demographics Similar to Immigrants from Grenada by Seniors Poverty Over the Age of 75
In terms of seniors poverty over the age of 75, the demographic groups most similar to Immigrants from Grenada are Cuban (18.0%, a difference of 0.59%), Immigrants from Nicaragua (17.6%, a difference of 1.5%), Immigrants from St. Vincent and the Grenadines (17.5%, a difference of 2.0%), Immigrants from Armenia (17.5%, a difference of 2.2%), and Immigrants from Caribbean (18.2%, a difference of 2.2%).
| Demographics | Rating | Rank | Seniors Poverty Over the Age of 75 |
| Sioux | 0.0 /100 | #327 | Tragic 16.8% |
| Cape Verdeans | 0.0 /100 | #328 | Tragic 16.8% |
| Immigrants | Dominica | 0.0 /100 | #329 | Tragic 17.0% |
| British West Indians | 0.0 /100 | #330 | Tragic 17.4% |
| Immigrants | Armenia | 0.0 /100 | #331 | Tragic 17.5% |
| Immigrants | St. Vincent and the Grenadines | 0.0 /100 | #332 | Tragic 17.5% |
| Immigrants | Nicaragua | 0.0 /100 | #333 | Tragic 17.6% |
| Immigrants | Grenada | 0.0 /100 | #334 | Tragic 17.8% |
| Cubans | 0.0 /100 | #335 | Tragic 18.0% |
| Immigrants | Caribbean | 0.0 /100 | #336 | Tragic 18.2% |
| Yakama | 0.0 /100 | #337 | Tragic 18.3% |
| Immigrants | Cabo Verde | 0.0 /100 | #338 | Tragic 18.5% |
| Hopi | 0.0 /100 | #339 | Tragic 18.9% |
| Tohono O'odham | 0.0 /100 | #340 | Tragic 19.1% |
| Navajo | 0.0 /100 | #341 | Tragic 19.4% |
Demographics Similar to Immigrants from Croatia by Seniors Poverty Over the Age of 75
In terms of seniors poverty over the age of 75, the demographic groups most similar to Immigrants from Croatia are Korean (11.5%, a difference of 0.020%), Immigrants from Sri Lanka (11.5%, a difference of 0.030%), Australian (11.5%, a difference of 0.050%), Immigrants from Bulgaria (11.5%, a difference of 0.070%), and Aleut (11.5%, a difference of 0.15%).
| Demographics | Rating | Rank | Seniors Poverty Over the Age of 75 |
| Basques | 95.1 /100 | #81 | Exceptional 11.5% |
| Iranians | 95.1 /100 | #82 | Exceptional 11.5% |
| Immigrants | South Africa | 94.9 /100 | #83 | Exceptional 11.5% |
| Immigrants | Iraq | 94.9 /100 | #84 | Exceptional 11.5% |
| Immigrants | Bulgaria | 94.7 /100 | #85 | Exceptional 11.5% |
| Australians | 94.6 /100 | #86 | Exceptional 11.5% |
| Koreans | 94.5 /100 | #87 | Exceptional 11.5% |
| Immigrants | Croatia | 94.5 /100 | #88 | Exceptional 11.5% |
| Immigrants | Sri Lanka | 94.4 /100 | #89 | Exceptional 11.5% |
| Aleuts | 94.1 /100 | #90 | Exceptional 11.5% |
| Immigrants | Germany | 94.1 /100 | #91 | Exceptional 11.5% |
| Kenyans | 93.9 /100 | #92 | Exceptional 11.5% |
| Immigrants | Poland | 92.9 /100 | #93 | Exceptional 11.6% |
| Creek | 92.7 /100 | #94 | Exceptional 11.6% |
| Immigrants | Bosnia and Herzegovina | 92.6 /100 | #95 | Exceptional 11.6% |