Costa Rican vs Immigrants from Croatia Seniors Poverty Over the Age of 75
COMPARE
Costa Rican
Immigrants from Croatia
Seniors Poverty Over the Age of 75
Seniors Poverty Over the Age of 75 Comparison
Costa Ricans
Immigrants from Croatia
12.8%
SENIORS POVERTY OVER THE AGE OF 75
8.7/ 100
METRIC RATING
207th/ 347
METRIC RANK
11.5%
SENIORS POVERTY OVER THE AGE OF 75
94.5/ 100
METRIC RATING
88th/ 347
METRIC RANK
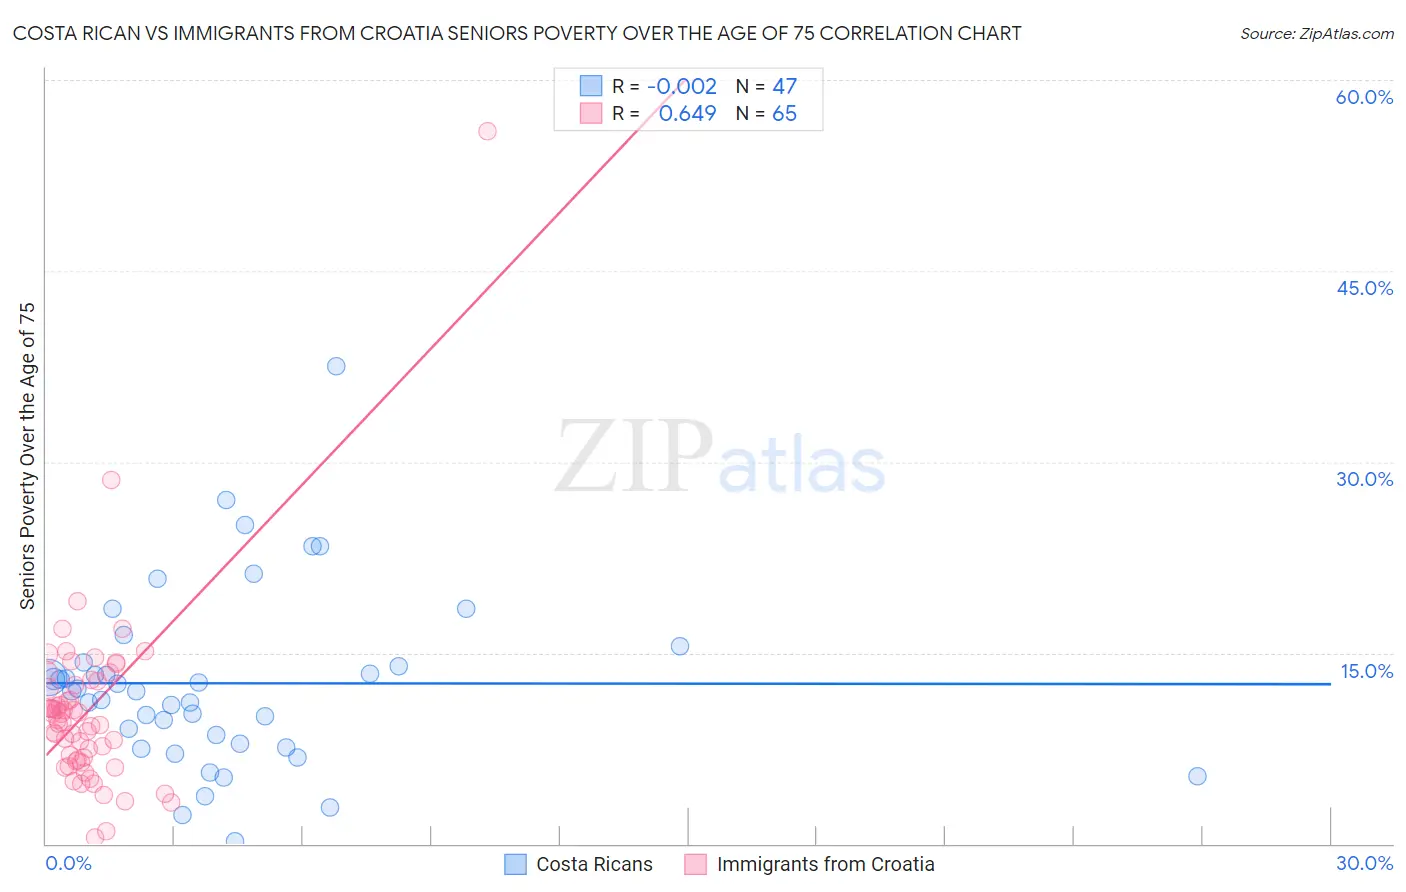
Costa Rican vs Immigrants from Croatia Seniors Poverty Over the Age of 75 Correlation Chart
The statistical analysis conducted on geographies consisting of 251,972,456 people shows no correlation between the proportion of Costa Ricans and poverty level among seniors over the age of 75 in the United States with a correlation coefficient (R) of -0.002 and weighted average of 12.8%. Similarly, the statistical analysis conducted on geographies consisting of 132,096,620 people shows a significant positive correlation between the proportion of Immigrants from Croatia and poverty level among seniors over the age of 75 in the United States with a correlation coefficient (R) of 0.649 and weighted average of 11.5%, a difference of 11.2%.
Seniors Poverty Over the Age of 75 Correlation Summary
| Measurement | Costa Rican | Immigrants from Croatia |
| Minimum | 0.17% | 0.52% |
| Maximum | 37.5% | 56.0% |
| Range | 37.3% | 55.5% |
| Mean | 12.6% | 10.5% |
| Median | 12.0% | 9.7% |
| Interquartile 25% (IQ1) | 7.9% | 6.5% |
| Interquartile 75% (IQ3) | 14.2% | 12.6% |
| Interquartile Range (IQR) | 6.3% | 6.1% |
| Standard Deviation (Sample) | 7.0% | 7.3% |
| Standard Deviation (Population) | 6.9% | 7.3% |
Similar Demographics by Seniors Poverty Over the Age of 75
Demographics Similar to Costa Ricans by Seniors Poverty Over the Age of 75
In terms of seniors poverty over the age of 75, the demographic groups most similar to Costa Ricans are Immigrants from Eastern Asia (12.8%, a difference of 0.080%), Albanian (12.7%, a difference of 0.20%), Indian (Asian) (12.7%, a difference of 0.24%), Immigrants from Liberia (12.8%, a difference of 0.36%), and Immigrants from Eritrea (12.7%, a difference of 0.40%).
| Demographics | Rating | Rank | Seniors Poverty Over the Age of 75 |
| Immigrants | Vietnam | 12.1 /100 | #200 | Poor 12.7% |
| Paraguayans | 11.1 /100 | #201 | Poor 12.7% |
| Arapaho | 10.9 /100 | #202 | Poor 12.7% |
| Immigrants | Southern Europe | 10.7 /100 | #203 | Poor 12.7% |
| Immigrants | Eritrea | 10.5 /100 | #204 | Poor 12.7% |
| Indians (Asian) | 9.7 /100 | #205 | Tragic 12.7% |
| Albanians | 9.6 /100 | #206 | Tragic 12.7% |
| Costa Ricans | 8.7 /100 | #207 | Tragic 12.8% |
| Immigrants | Eastern Asia | 8.4 /100 | #208 | Tragic 12.8% |
| Immigrants | Liberia | 7.3 /100 | #209 | Tragic 12.8% |
| Comanche | 7.0 /100 | #210 | Tragic 12.8% |
| Brazilians | 6.9 /100 | #211 | Tragic 12.8% |
| Immigrants | Hong Kong | 6.5 /100 | #212 | Tragic 12.8% |
| French American Indians | 6.1 /100 | #213 | Tragic 12.9% |
| Immigrants | Africa | 5.9 /100 | #214 | Tragic 12.9% |
Demographics Similar to Immigrants from Croatia by Seniors Poverty Over the Age of 75
In terms of seniors poverty over the age of 75, the demographic groups most similar to Immigrants from Croatia are Korean (11.5%, a difference of 0.020%), Immigrants from Sri Lanka (11.5%, a difference of 0.030%), Australian (11.5%, a difference of 0.050%), Immigrants from Bulgaria (11.5%, a difference of 0.070%), and Aleut (11.5%, a difference of 0.15%).
| Demographics | Rating | Rank | Seniors Poverty Over the Age of 75 |
| Basques | 95.1 /100 | #81 | Exceptional 11.5% |
| Iranians | 95.1 /100 | #82 | Exceptional 11.5% |
| Immigrants | South Africa | 94.9 /100 | #83 | Exceptional 11.5% |
| Immigrants | Iraq | 94.9 /100 | #84 | Exceptional 11.5% |
| Immigrants | Bulgaria | 94.7 /100 | #85 | Exceptional 11.5% |
| Australians | 94.6 /100 | #86 | Exceptional 11.5% |
| Koreans | 94.5 /100 | #87 | Exceptional 11.5% |
| Immigrants | Croatia | 94.5 /100 | #88 | Exceptional 11.5% |
| Immigrants | Sri Lanka | 94.4 /100 | #89 | Exceptional 11.5% |
| Aleuts | 94.1 /100 | #90 | Exceptional 11.5% |
| Immigrants | Germany | 94.1 /100 | #91 | Exceptional 11.5% |
| Kenyans | 93.9 /100 | #92 | Exceptional 11.5% |
| Immigrants | Poland | 92.9 /100 | #93 | Exceptional 11.6% |
| Creek | 92.7 /100 | #94 | Exceptional 11.6% |
| Immigrants | Bosnia and Herzegovina | 92.6 /100 | #95 | Exceptional 11.6% |