Immigrants from Greece vs Native/Alaskan Seniors Poverty Over the Age of 75
COMPARE
Immigrants from Greece
Native/Alaskan
Seniors Poverty Over the Age of 75
Seniors Poverty Over the Age of 75 Comparison
Immigrants from Greece
Natives/Alaskans
12.1%
SENIORS POVERTY OVER THE AGE OF 75
58.2/ 100
METRIC RATING
163rd/ 347
METRIC RANK
15.5%
SENIORS POVERTY OVER THE AGE OF 75
0.0/ 100
METRIC RATING
298th/ 347
METRIC RANK
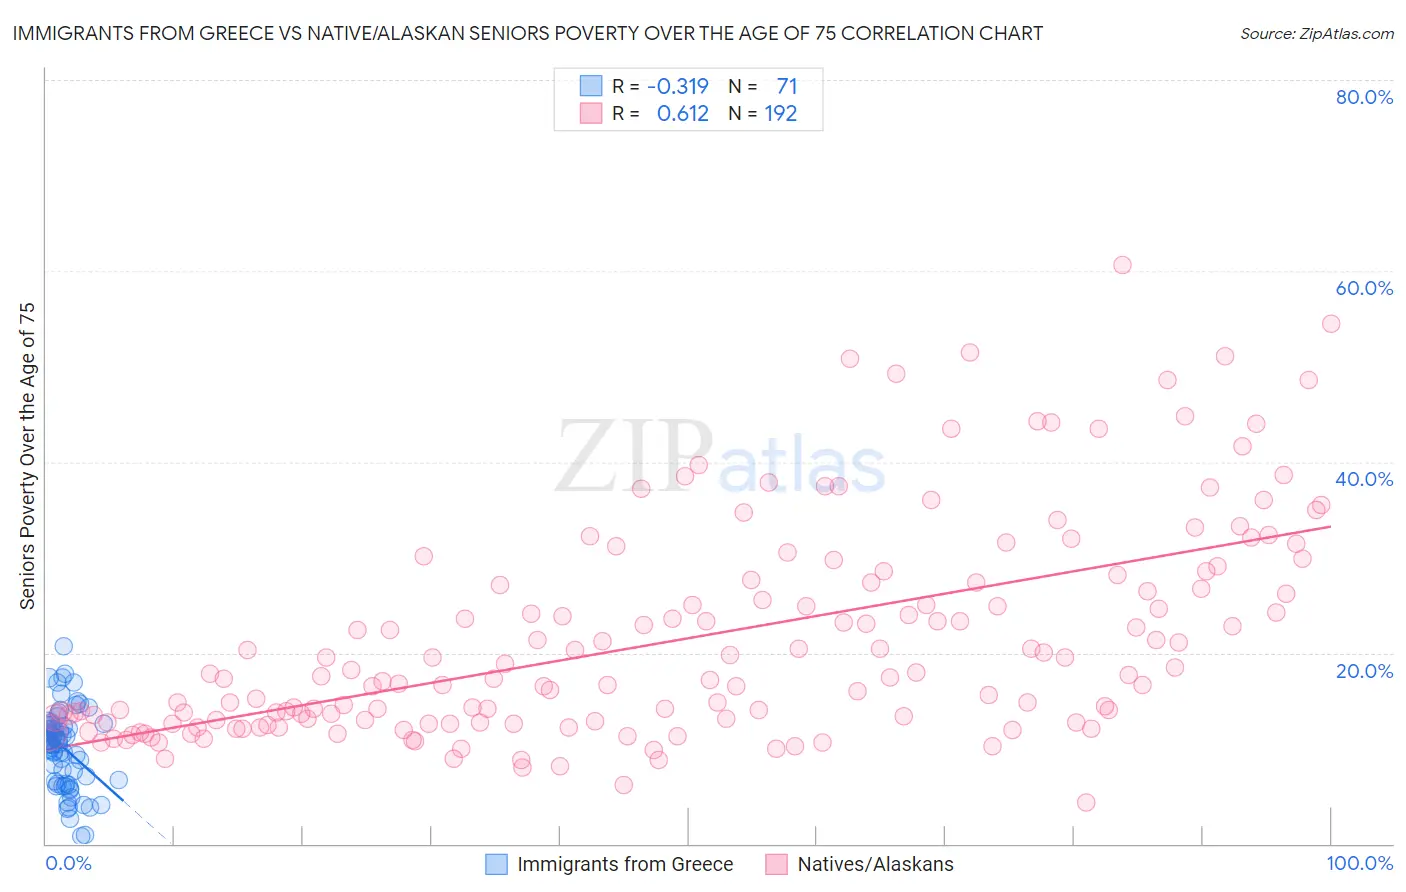
Immigrants from Greece vs Native/Alaskan Seniors Poverty Over the Age of 75 Correlation Chart
The statistical analysis conducted on geographies consisting of 215,709,798 people shows a mild negative correlation between the proportion of Immigrants from Greece and poverty level among seniors over the age of 75 in the United States with a correlation coefficient (R) of -0.319 and weighted average of 12.1%. Similarly, the statistical analysis conducted on geographies consisting of 503,579,334 people shows a significant positive correlation between the proportion of Natives/Alaskans and poverty level among seniors over the age of 75 in the United States with a correlation coefficient (R) of 0.612 and weighted average of 15.5%, a difference of 28.0%.
Seniors Poverty Over the Age of 75 Correlation Summary
| Measurement | Immigrants from Greece | Native/Alaskan |
| Minimum | 0.75% | 4.3% |
| Maximum | 20.7% | 60.7% |
| Range | 19.9% | 56.3% |
| Mean | 10.0% | 21.4% |
| Median | 10.4% | 17.5% |
| Interquartile 25% (IQ1) | 6.3% | 12.8% |
| Interquartile 75% (IQ3) | 12.5% | 27.3% |
| Interquartile Range (IQR) | 6.1% | 14.6% |
| Standard Deviation (Sample) | 4.2% | 11.2% |
| Standard Deviation (Population) | 4.2% | 11.2% |
Similar Demographics by Seniors Poverty Over the Age of 75
Demographics Similar to Immigrants from Greece by Seniors Poverty Over the Age of 75
In terms of seniors poverty over the age of 75, the demographic groups most similar to Immigrants from Greece are Potawatomi (12.1%, a difference of 0.070%), Okinawan (12.1%, a difference of 0.16%), Immigrants from Serbia (12.1%, a difference of 0.17%), Immigrants from Norway (12.1%, a difference of 0.21%), and Immigrants from Eastern Africa (12.1%, a difference of 0.23%).
| Demographics | Rating | Rank | Seniors Poverty Over the Age of 75 |
| Immigrants | Burma/Myanmar | 62.3 /100 | #156 | Good 12.1% |
| Immigrants | Sudan | 61.7 /100 | #157 | Good 12.1% |
| Portuguese | 61.3 /100 | #158 | Good 12.1% |
| Immigrants | Middle Africa | 61.2 /100 | #159 | Good 12.1% |
| Immigrants | Eastern Africa | 60.9 /100 | #160 | Good 12.1% |
| Immigrants | Norway | 60.6 /100 | #161 | Good 12.1% |
| Immigrants | Serbia | 60.2 /100 | #162 | Good 12.1% |
| Immigrants | Greece | 58.2 /100 | #163 | Average 12.1% |
| Potawatomi | 57.4 /100 | #164 | Average 12.1% |
| Okinawans | 56.3 /100 | #165 | Average 12.1% |
| Egyptians | 54.8 /100 | #166 | Average 12.1% |
| Immigrants | Switzerland | 54.5 /100 | #167 | Average 12.1% |
| Immigrants | Syria | 53.9 /100 | #168 | Average 12.2% |
| Immigrants | Egypt | 53.7 /100 | #169 | Average 12.2% |
| Immigrants | Thailand | 52.0 /100 | #170 | Average 12.2% |
Demographics Similar to Natives/Alaskans by Seniors Poverty Over the Age of 75
In terms of seniors poverty over the age of 75, the demographic groups most similar to Natives/Alaskans are Spanish American Indian (15.5%, a difference of 0.10%), Bahamian (15.5%, a difference of 0.11%), Honduran (15.4%, a difference of 0.34%), Yuman (15.4%, a difference of 0.62%), and U.S. Virgin Islander (15.4%, a difference of 0.80%).
| Demographics | Rating | Rank | Seniors Poverty Over the Age of 75 |
| Paiute | 0.0 /100 | #291 | Tragic 15.2% |
| Colville | 0.0 /100 | #292 | Tragic 15.2% |
| Apache | 0.0 /100 | #293 | Tragic 15.3% |
| Immigrants | Jamaica | 0.0 /100 | #294 | Tragic 15.3% |
| U.S. Virgin Islanders | 0.0 /100 | #295 | Tragic 15.4% |
| Yuman | 0.0 /100 | #296 | Tragic 15.4% |
| Hondurans | 0.0 /100 | #297 | Tragic 15.4% |
| Natives/Alaskans | 0.0 /100 | #298 | Tragic 15.5% |
| Spanish American Indians | 0.0 /100 | #299 | Tragic 15.5% |
| Bahamians | 0.0 /100 | #300 | Tragic 15.5% |
| Immigrants | Latin America | 0.0 /100 | #301 | Tragic 15.6% |
| West Indians | 0.0 /100 | #302 | Tragic 15.7% |
| Immigrants | Honduras | 0.0 /100 | #303 | Tragic 15.7% |
| Immigrants | Trinidad and Tobago | 0.0 /100 | #304 | Tragic 15.7% |
| Ecuadorians | 0.0 /100 | #305 | Tragic 15.7% |