Immigrants from Austria vs Native/Alaskan Seniors Poverty Over the Age of 75
COMPARE
Immigrants from Austria
Native/Alaskan
Seniors Poverty Over the Age of 75
Seniors Poverty Over the Age of 75 Comparison
Immigrants from Austria
Natives/Alaskans
11.4%
SENIORS POVERTY OVER THE AGE OF 75
96.5/ 100
METRIC RATING
68th/ 347
METRIC RANK
15.5%
SENIORS POVERTY OVER THE AGE OF 75
0.0/ 100
METRIC RATING
298th/ 347
METRIC RANK
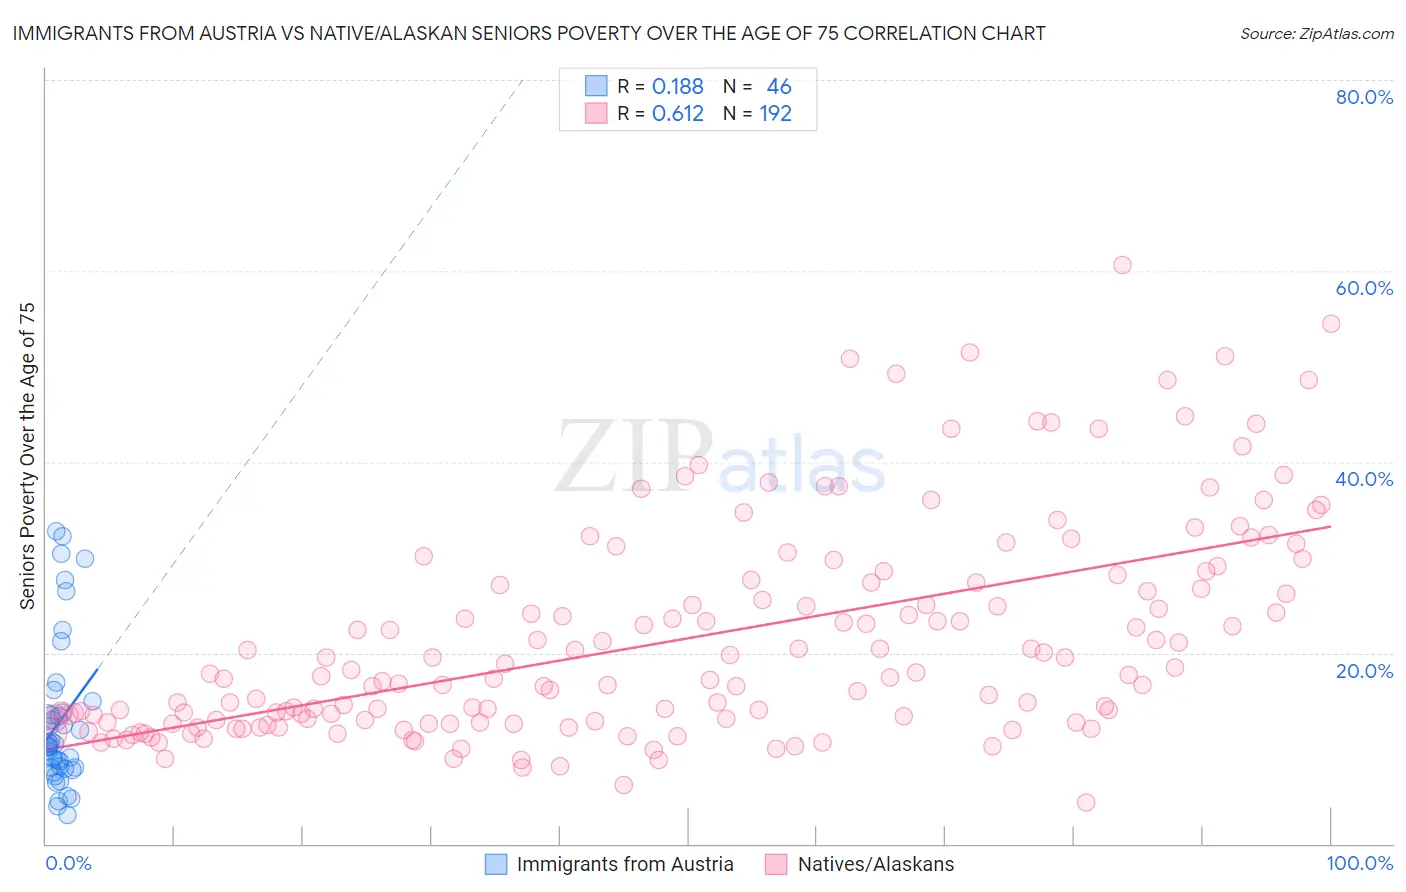
Immigrants from Austria vs Native/Alaskan Seniors Poverty Over the Age of 75 Correlation Chart
The statistical analysis conducted on geographies consisting of 167,095,547 people shows a poor positive correlation between the proportion of Immigrants from Austria and poverty level among seniors over the age of 75 in the United States with a correlation coefficient (R) of 0.188 and weighted average of 11.4%. Similarly, the statistical analysis conducted on geographies consisting of 503,579,334 people shows a significant positive correlation between the proportion of Natives/Alaskans and poverty level among seniors over the age of 75 in the United States with a correlation coefficient (R) of 0.612 and weighted average of 15.5%, a difference of 36.3%.
Seniors Poverty Over the Age of 75 Correlation Summary
| Measurement | Immigrants from Austria | Native/Alaskan |
| Minimum | 3.1% | 4.3% |
| Maximum | 32.7% | 60.7% |
| Range | 29.6% | 56.3% |
| Mean | 12.8% | 21.4% |
| Median | 10.3% | 17.5% |
| Interquartile 25% (IQ1) | 7.9% | 12.8% |
| Interquartile 75% (IQ3) | 13.8% | 27.3% |
| Interquartile Range (IQR) | 5.8% | 14.6% |
| Standard Deviation (Sample) | 7.8% | 11.2% |
| Standard Deviation (Population) | 7.7% | 11.2% |
Similar Demographics by Seniors Poverty Over the Age of 75
Demographics Similar to Immigrants from Austria by Seniors Poverty Over the Age of 75
In terms of seniors poverty over the age of 75, the demographic groups most similar to Immigrants from Austria are Ottawa (11.4%, a difference of 0.010%), Bolivian (11.4%, a difference of 0.020%), Immigrants from South Central Asia (11.4%, a difference of 0.050%), Estonian (11.4%, a difference of 0.11%), and Osage (11.4%, a difference of 0.12%).
| Demographics | Rating | Rank | Seniors Poverty Over the Age of 75 |
| Canadians | 97.7 /100 | #61 | Exceptional 11.3% |
| Immigrants | North America | 97.6 /100 | #62 | Exceptional 11.3% |
| Immigrants | Afghanistan | 97.5 /100 | #63 | Exceptional 11.3% |
| Immigrants | Northern Europe | 97.4 /100 | #64 | Exceptional 11.3% |
| Immigrants | Taiwan | 96.7 /100 | #65 | Exceptional 11.4% |
| Estonians | 96.7 /100 | #66 | Exceptional 11.4% |
| Bolivians | 96.5 /100 | #67 | Exceptional 11.4% |
| Immigrants | Austria | 96.5 /100 | #68 | Exceptional 11.4% |
| Ottawa | 96.5 /100 | #69 | Exceptional 11.4% |
| Immigrants | South Central Asia | 96.4 /100 | #70 | Exceptional 11.4% |
| Osage | 96.3 /100 | #71 | Exceptional 11.4% |
| Sierra Leoneans | 96.1 /100 | #72 | Exceptional 11.4% |
| Immigrants | Micronesia | 96.0 /100 | #73 | Exceptional 11.4% |
| Delaware | 96.0 /100 | #74 | Exceptional 11.4% |
| Palestinians | 95.8 /100 | #75 | Exceptional 11.4% |
Demographics Similar to Natives/Alaskans by Seniors Poverty Over the Age of 75
In terms of seniors poverty over the age of 75, the demographic groups most similar to Natives/Alaskans are Spanish American Indian (15.5%, a difference of 0.10%), Bahamian (15.5%, a difference of 0.11%), Honduran (15.4%, a difference of 0.34%), Yuman (15.4%, a difference of 0.62%), and U.S. Virgin Islander (15.4%, a difference of 0.80%).
| Demographics | Rating | Rank | Seniors Poverty Over the Age of 75 |
| Paiute | 0.0 /100 | #291 | Tragic 15.2% |
| Colville | 0.0 /100 | #292 | Tragic 15.2% |
| Apache | 0.0 /100 | #293 | Tragic 15.3% |
| Immigrants | Jamaica | 0.0 /100 | #294 | Tragic 15.3% |
| U.S. Virgin Islanders | 0.0 /100 | #295 | Tragic 15.4% |
| Yuman | 0.0 /100 | #296 | Tragic 15.4% |
| Hondurans | 0.0 /100 | #297 | Tragic 15.4% |
| Natives/Alaskans | 0.0 /100 | #298 | Tragic 15.5% |
| Spanish American Indians | 0.0 /100 | #299 | Tragic 15.5% |
| Bahamians | 0.0 /100 | #300 | Tragic 15.5% |
| Immigrants | Latin America | 0.0 /100 | #301 | Tragic 15.6% |
| West Indians | 0.0 /100 | #302 | Tragic 15.7% |
| Immigrants | Honduras | 0.0 /100 | #303 | Tragic 15.7% |
| Immigrants | Trinidad and Tobago | 0.0 /100 | #304 | Tragic 15.7% |
| Ecuadorians | 0.0 /100 | #305 | Tragic 15.7% |