Immigrants from France vs Iranian Child Poverty Under the Age of 16
COMPARE
Immigrants from France
Iranian
Child Poverty Under the Age of 16
Child Poverty Under the Age of 16 Comparison
Immigrants from France
Iranians
14.7%
CHILD POVERTY UNDER THE AGE OF 16
95.8/ 100
METRIC RATING
96th/ 347
METRIC RANK
12.2%
CHILD POVERTY UNDER THE AGE OF 16
100.0/ 100
METRIC RATING
7th/ 347
METRIC RANK
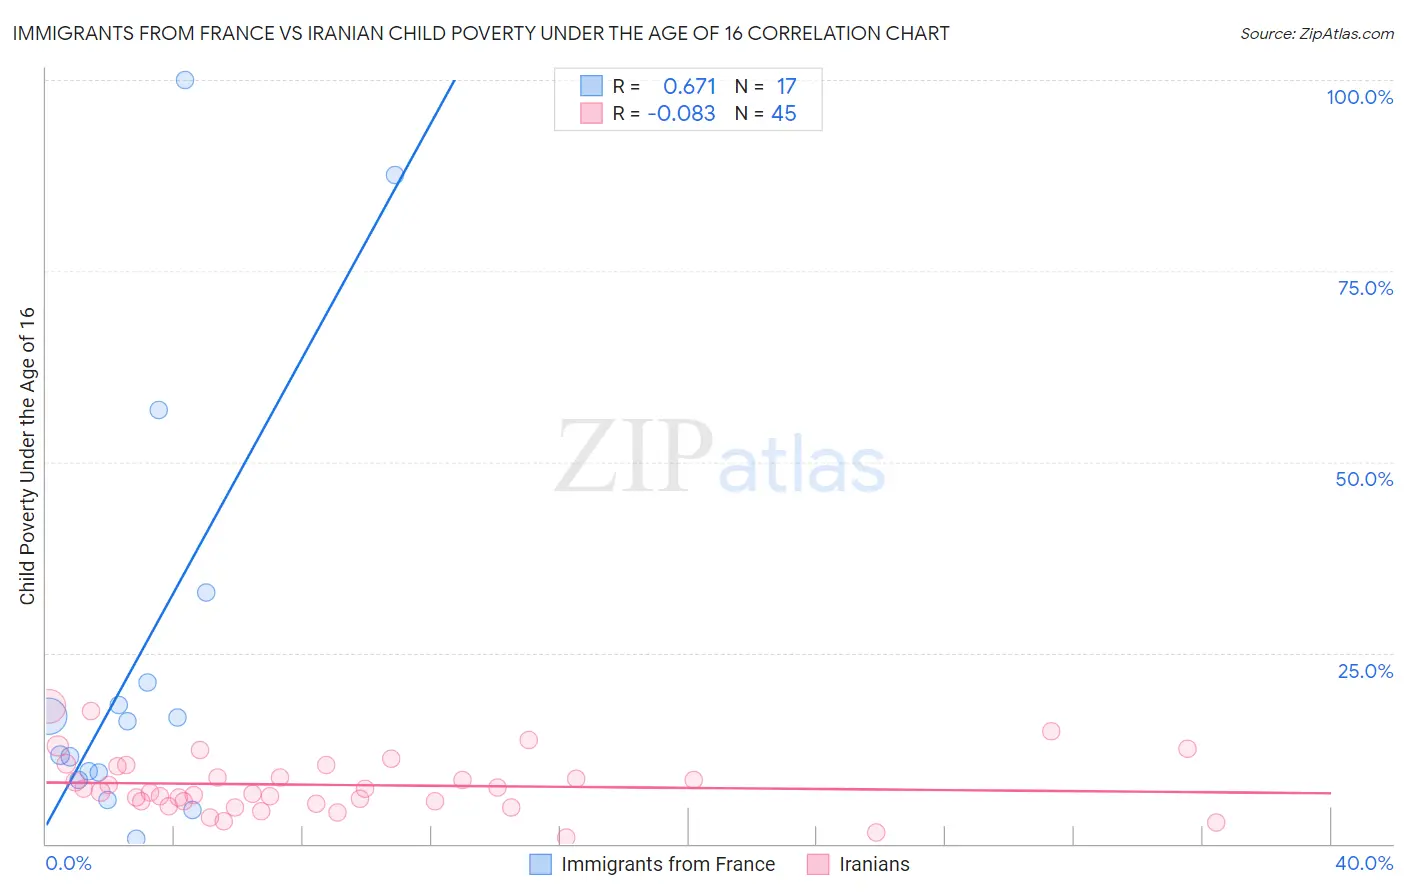
Immigrants from France vs Iranian Child Poverty Under the Age of 16 Correlation Chart
The statistical analysis conducted on geographies consisting of 285,695,647 people shows a significant positive correlation between the proportion of Immigrants from France and poverty level among children under the age of 16 in the United States with a correlation coefficient (R) of 0.671 and weighted average of 14.7%. Similarly, the statistical analysis conducted on geographies consisting of 314,255,547 people shows a slight negative correlation between the proportion of Iranians and poverty level among children under the age of 16 in the United States with a correlation coefficient (R) of -0.083 and weighted average of 12.2%, a difference of 20.0%.
Child Poverty Under the Age of 16 Correlation Summary
| Measurement | Immigrants from France | Iranian |
| Minimum | 0.60% | 0.81% |
| Maximum | 100.0% | 17.9% |
| Range | 99.4% | 17.1% |
| Mean | 25.1% | 7.7% |
| Median | 16.0% | 6.8% |
| Interquartile 25% (IQ1) | 8.9% | 5.4% |
| Interquartile 75% (IQ3) | 27.0% | 10.2% |
| Interquartile Range (IQR) | 18.1% | 4.8% |
| Standard Deviation (Sample) | 28.9% | 3.8% |
| Standard Deviation (Population) | 28.1% | 3.8% |
Similar Demographics by Child Poverty Under the Age of 16
Demographics Similar to Immigrants from France by Child Poverty Under the Age of 16
In terms of child poverty under the age of 16, the demographic groups most similar to Immigrants from France are Paraguayan (14.7%, a difference of 0.12%), Immigrants from Belarus (14.7%, a difference of 0.13%), Immigrants from Croatia (14.6%, a difference of 0.25%), British (14.7%, a difference of 0.25%), and Immigrants from South Africa (14.6%, a difference of 0.41%).
| Demographics | Rating | Rank | Child Poverty Under the Age of 16 |
| Germans | 96.9 /100 | #89 | Exceptional 14.5% |
| Austrians | 96.9 /100 | #90 | Exceptional 14.5% |
| Immigrants | North America | 96.7 /100 | #91 | Exceptional 14.6% |
| Immigrants | Italy | 96.7 /100 | #92 | Exceptional 14.6% |
| Argentineans | 96.6 /100 | #93 | Exceptional 14.6% |
| Immigrants | South Africa | 96.3 /100 | #94 | Exceptional 14.6% |
| Immigrants | Croatia | 96.1 /100 | #95 | Exceptional 14.6% |
| Immigrants | France | 95.8 /100 | #96 | Exceptional 14.7% |
| Paraguayans | 95.7 /100 | #97 | Exceptional 14.7% |
| Immigrants | Belarus | 95.7 /100 | #98 | Exceptional 14.7% |
| British | 95.5 /100 | #99 | Exceptional 14.7% |
| Dutch | 95.1 /100 | #100 | Exceptional 14.8% |
| Immigrants | Switzerland | 95.1 /100 | #101 | Exceptional 14.8% |
| Romanians | 95.0 /100 | #102 | Exceptional 14.8% |
| Immigrants | Egypt | 94.9 /100 | #103 | Exceptional 14.8% |
Demographics Similar to Iranians by Child Poverty Under the Age of 16
In terms of child poverty under the age of 16, the demographic groups most similar to Iranians are Immigrants from Hong Kong (12.1%, a difference of 0.76%), Immigrants from Singapore (12.4%, a difference of 1.1%), Immigrants from Iran (12.4%, a difference of 1.2%), Immigrants from South Central Asia (12.5%, a difference of 2.4%), and Bhutanese (12.5%, a difference of 2.4%).
| Demographics | Rating | Rank | Child Poverty Under the Age of 16 |
| Immigrants | India | 100.0 /100 | #1 | Exceptional 10.8% |
| Immigrants | Taiwan | 100.0 /100 | #2 | Exceptional 11.0% |
| Filipinos | 100.0 /100 | #3 | Exceptional 11.1% |
| Thais | 100.0 /100 | #4 | Exceptional 11.6% |
| Chinese | 100.0 /100 | #5 | Exceptional 11.9% |
| Immigrants | Hong Kong | 100.0 /100 | #6 | Exceptional 12.1% |
| Iranians | 100.0 /100 | #7 | Exceptional 12.2% |
| Immigrants | Singapore | 100.0 /100 | #8 | Exceptional 12.4% |
| Immigrants | Iran | 100.0 /100 | #9 | Exceptional 12.4% |
| Immigrants | South Central Asia | 99.9 /100 | #10 | Exceptional 12.5% |
| Bhutanese | 99.9 /100 | #11 | Exceptional 12.5% |
| Immigrants | Ireland | 99.9 /100 | #12 | Exceptional 12.7% |
| Burmese | 99.9 /100 | #13 | Exceptional 12.8% |
| Immigrants | Lithuania | 99.9 /100 | #14 | Exceptional 12.9% |
| Immigrants | Korea | 99.9 /100 | #15 | Exceptional 13.0% |