Immigrants from France vs Carpatho Rusyn Child Poverty Under the Age of 16
COMPARE
Immigrants from France
Carpatho Rusyn
Child Poverty Under the Age of 16
Child Poverty Under the Age of 16 Comparison
Immigrants from France
Carpatho Rusyns
14.7%
CHILD POVERTY UNDER THE AGE OF 16
95.8/ 100
METRIC RATING
96th/ 347
METRIC RANK
14.9%
CHILD POVERTY UNDER THE AGE OF 16
93.1/ 100
METRIC RATING
116th/ 347
METRIC RANK
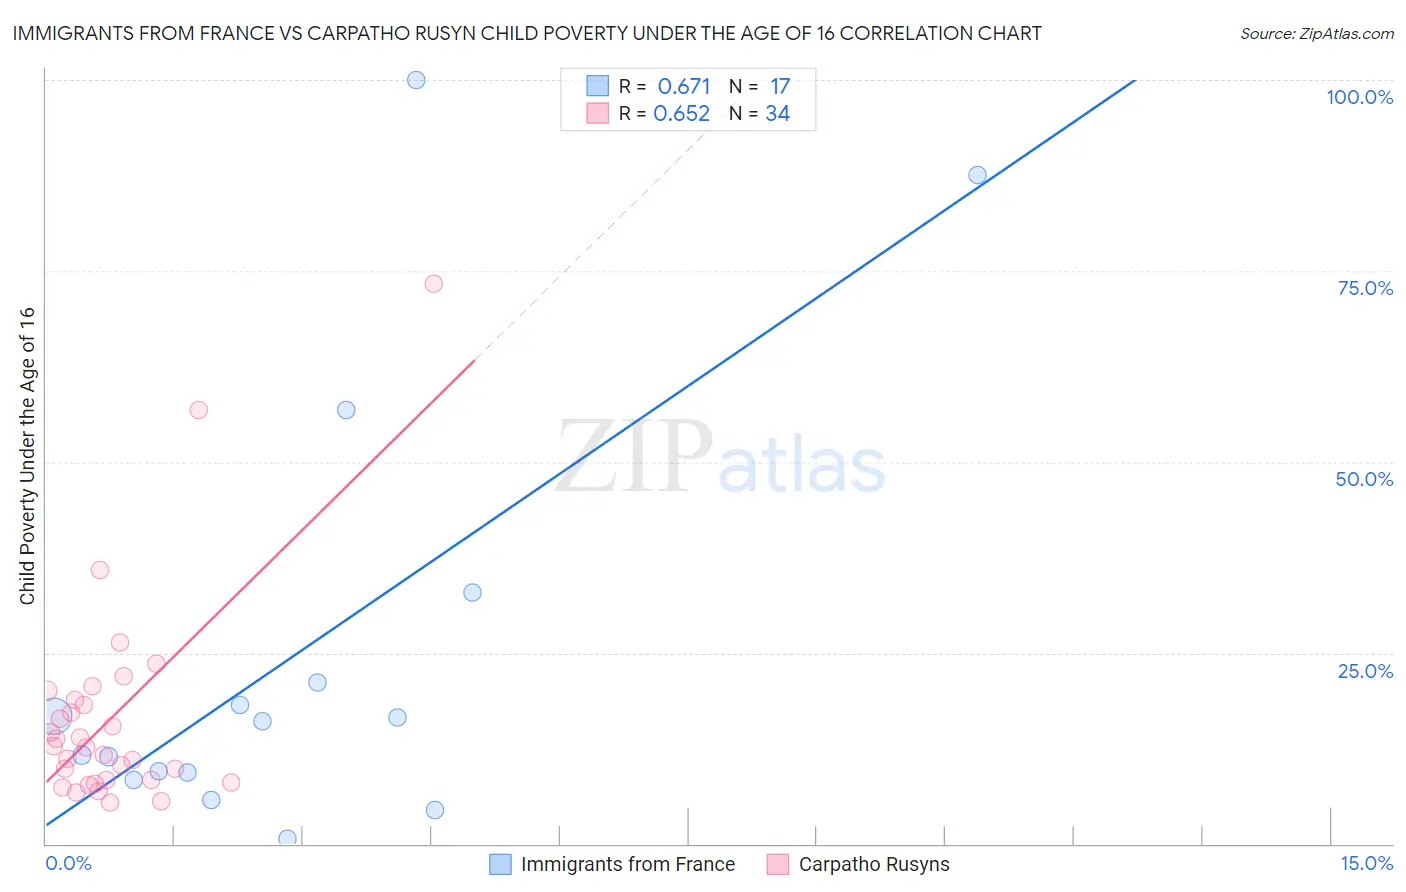
Immigrants from France vs Carpatho Rusyn Child Poverty Under the Age of 16 Correlation Chart
The statistical analysis conducted on geographies consisting of 285,695,647 people shows a significant positive correlation between the proportion of Immigrants from France and poverty level among children under the age of 16 in the United States with a correlation coefficient (R) of 0.671 and weighted average of 14.7%. Similarly, the statistical analysis conducted on geographies consisting of 58,679,406 people shows a significant positive correlation between the proportion of Carpatho Rusyns and poverty level among children under the age of 16 in the United States with a correlation coefficient (R) of 0.652 and weighted average of 14.9%, a difference of 1.8%.
Child Poverty Under the Age of 16 Correlation Summary
| Measurement | Immigrants from France | Carpatho Rusyn |
| Minimum | 0.60% | 5.3% |
| Maximum | 100.0% | 73.3% |
| Range | 99.4% | 68.0% |
| Mean | 25.1% | 16.7% |
| Median | 16.0% | 12.7% |
| Interquartile 25% (IQ1) | 8.9% | 8.4% |
| Interquartile 75% (IQ3) | 27.0% | 18.8% |
| Interquartile Range (IQR) | 18.1% | 10.5% |
| Standard Deviation (Sample) | 28.9% | 14.1% |
| Standard Deviation (Population) | 28.1% | 13.9% |
Demographics Similar to Immigrants from France and Carpatho Rusyns by Child Poverty Under the Age of 16
In terms of child poverty under the age of 16, the demographic groups most similar to Immigrants from France are Paraguayan (14.7%, a difference of 0.12%), Immigrants from Belarus (14.7%, a difference of 0.13%), British (14.7%, a difference of 0.25%), Dutch (14.8%, a difference of 0.56%), and Immigrants from Switzerland (14.8%, a difference of 0.58%). Similarly, the demographic groups most similar to Carpatho Rusyns are Immigrants from Ukraine (14.9%, a difference of 0.020%), Sri Lankan (14.9%, a difference of 0.080%), Belgian (14.9%, a difference of 0.11%), Irish (14.9%, a difference of 0.15%), and Immigrants from Denmark (14.9%, a difference of 0.21%).
| Demographics | Rating | Rank | Child Poverty Under the Age of 16 |
| Immigrants | France | 95.8 /100 | #96 | Exceptional 14.7% |
| Paraguayans | 95.7 /100 | #97 | Exceptional 14.7% |
| Immigrants | Belarus | 95.7 /100 | #98 | Exceptional 14.7% |
| British | 95.5 /100 | #99 | Exceptional 14.7% |
| Dutch | 95.1 /100 | #100 | Exceptional 14.8% |
| Immigrants | Switzerland | 95.1 /100 | #101 | Exceptional 14.8% |
| Romanians | 95.0 /100 | #102 | Exceptional 14.8% |
| Immigrants | Egypt | 94.9 /100 | #103 | Exceptional 14.8% |
| Immigrants | England | 94.8 /100 | #104 | Exceptional 14.8% |
| Basques | 94.7 /100 | #105 | Exceptional 14.8% |
| Serbians | 94.5 /100 | #106 | Exceptional 14.8% |
| Chileans | 94.4 /100 | #107 | Exceptional 14.8% |
| Jordanians | 94.2 /100 | #108 | Exceptional 14.8% |
| Tlingit-Haida | 94.1 /100 | #109 | Exceptional 14.9% |
| English | 93.5 /100 | #110 | Exceptional 14.9% |
| Immigrants | Denmark | 93.5 /100 | #111 | Exceptional 14.9% |
| Irish | 93.4 /100 | #112 | Exceptional 14.9% |
| Belgians | 93.3 /100 | #113 | Exceptional 14.9% |
| Sri Lankans | 93.2 /100 | #114 | Exceptional 14.9% |
| Immigrants | Ukraine | 93.1 /100 | #115 | Exceptional 14.9% |
| Carpatho Rusyns | 93.1 /100 | #116 | Exceptional 14.9% |