Immigrants from Eritrea vs Cape Verdean Child Poverty Under the Age of 16
COMPARE
Immigrants from Eritrea
Cape Verdean
Child Poverty Under the Age of 16
Child Poverty Under the Age of 16 Comparison
Immigrants from Eritrea
Cape Verdeans
18.5%
CHILD POVERTY UNDER THE AGE OF 16
0.8/ 100
METRIC RATING
238th/ 347
METRIC RANK
18.7%
CHILD POVERTY UNDER THE AGE OF 16
0.6/ 100
METRIC RATING
244th/ 347
METRIC RANK
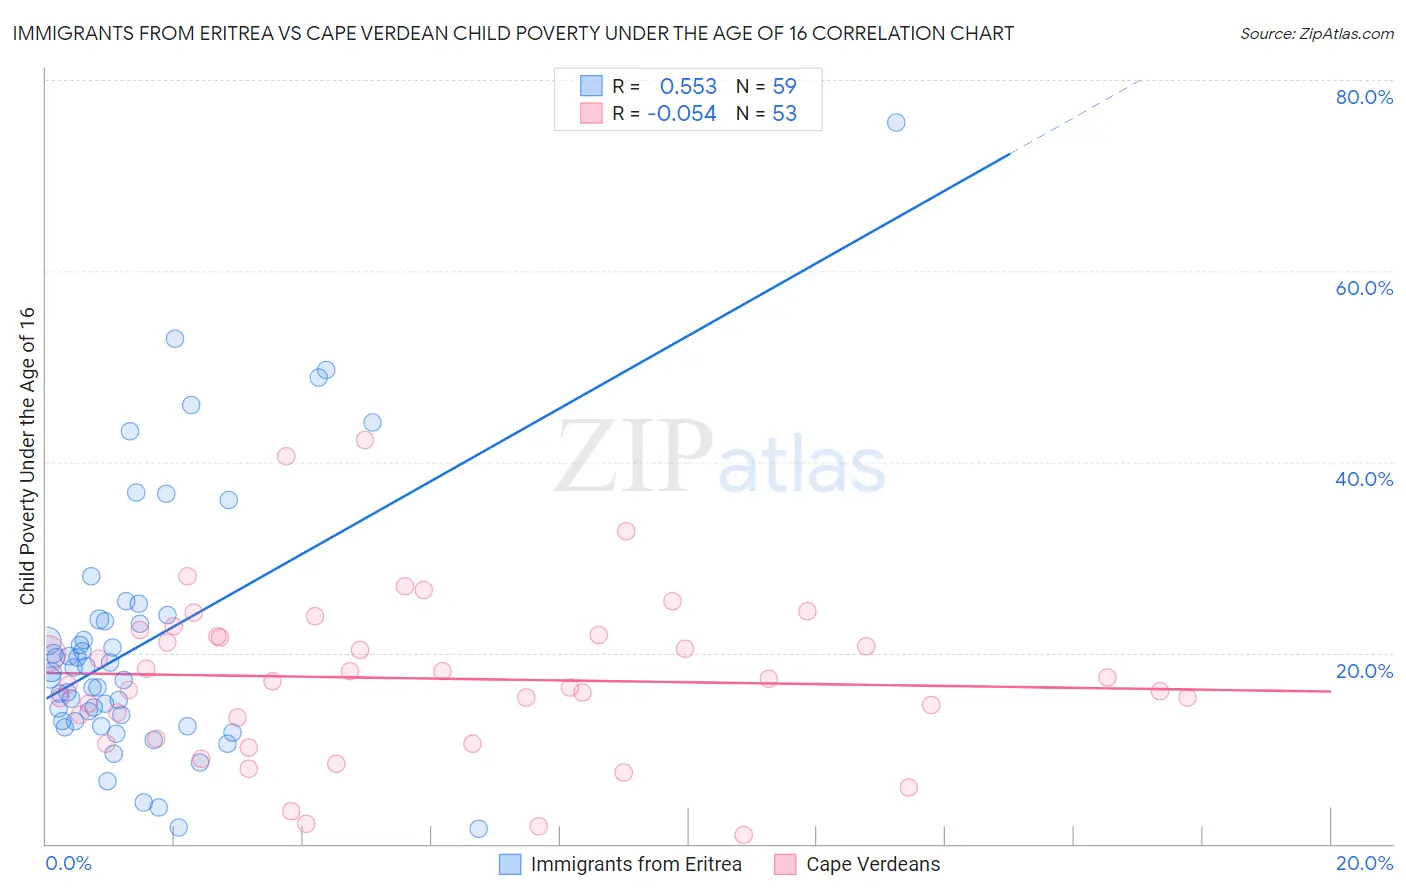
Immigrants from Eritrea vs Cape Verdean Child Poverty Under the Age of 16 Correlation Chart
The statistical analysis conducted on geographies consisting of 104,763,479 people shows a substantial positive correlation between the proportion of Immigrants from Eritrea and poverty level among children under the age of 16 in the United States with a correlation coefficient (R) of 0.553 and weighted average of 18.5%. Similarly, the statistical analysis conducted on geographies consisting of 107,159,095 people shows a slight negative correlation between the proportion of Cape Verdeans and poverty level among children under the age of 16 in the United States with a correlation coefficient (R) of -0.054 and weighted average of 18.7%, a difference of 0.87%.
Child Poverty Under the Age of 16 Correlation Summary
| Measurement | Immigrants from Eritrea | Cape Verdean |
| Minimum | 1.6% | 0.98% |
| Maximum | 75.6% | 42.3% |
| Range | 74.0% | 41.3% |
| Mean | 21.0% | 17.3% |
| Median | 18.0% | 17.0% |
| Interquartile 25% (IQ1) | 12.8% | 12.1% |
| Interquartile 75% (IQ3) | 23.5% | 21.8% |
| Interquartile Range (IQR) | 10.7% | 9.7% |
| Standard Deviation (Sample) | 13.9% | 8.5% |
| Standard Deviation (Population) | 13.7% | 8.4% |
Demographics Similar to Immigrants from Eritrea and Cape Verdeans by Child Poverty Under the Age of 16
In terms of child poverty under the age of 16, the demographic groups most similar to Immigrants from Eritrea are Immigrants from Sudan (18.5%, a difference of 0.040%), Ghanaian (18.6%, a difference of 0.080%), Sudanese (18.5%, a difference of 0.24%), Cree (18.5%, a difference of 0.27%), and Alsatian (18.6%, a difference of 0.55%). Similarly, the demographic groups most similar to Cape Verdeans are Immigrants from Cuba (18.7%, a difference of 0.070%), Immigrants from Laos (18.7%, a difference of 0.20%), Alsatian (18.6%, a difference of 0.32%), Shoshone (18.8%, a difference of 0.65%), and Immigrants from Nicaragua (18.8%, a difference of 0.68%).
| Demographics | Rating | Rank | Child Poverty Under the Age of 16 |
| Nicaraguans | 1.7 /100 | #231 | Tragic 18.2% |
| Americans | 1.2 /100 | #232 | Tragic 18.3% |
| Fijians | 1.1 /100 | #233 | Tragic 18.4% |
| Immigrants | Nigeria | 1.0 /100 | #234 | Tragic 18.4% |
| Nigerians | 1.0 /100 | #235 | Tragic 18.4% |
| Cree | 0.9 /100 | #236 | Tragic 18.5% |
| Sudanese | 0.9 /100 | #237 | Tragic 18.5% |
| Immigrants | Eritrea | 0.8 /100 | #238 | Tragic 18.5% |
| Immigrants | Sudan | 0.8 /100 | #239 | Tragic 18.5% |
| Ghanaians | 0.8 /100 | #240 | Tragic 18.6% |
| Alsatians | 0.7 /100 | #241 | Tragic 18.6% |
| Immigrants | Laos | 0.6 /100 | #242 | Tragic 18.7% |
| Immigrants | Cuba | 0.6 /100 | #243 | Tragic 18.7% |
| Cape Verdeans | 0.6 /100 | #244 | Tragic 18.7% |
| Shoshone | 0.5 /100 | #245 | Tragic 18.8% |
| Immigrants | Nicaragua | 0.4 /100 | #246 | Tragic 18.8% |
| French American Indians | 0.4 /100 | #247 | Tragic 18.9% |
| Ecuadorians | 0.3 /100 | #248 | Tragic 19.0% |
| Potawatomi | 0.3 /100 | #249 | Tragic 19.0% |
| Immigrants | Middle Africa | 0.3 /100 | #250 | Tragic 19.0% |
| Immigrants | Ghana | 0.3 /100 | #251 | Tragic 19.1% |