Immigrants from Dominican Republic vs Immigrants from South Central Asia Seniors Poverty Over the Age of 75
COMPARE
Immigrants from Dominican Republic
Immigrants from South Central Asia
Seniors Poverty Over the Age of 75
Seniors Poverty Over the Age of 75 Comparison
Immigrants from Dominican Republic
Immigrants from South Central Asia
20.1%
SENIORS POVERTY OVER THE AGE OF 75
0.0/ 100
METRIC RATING
345th/ 347
METRIC RANK
11.4%
SENIORS POVERTY OVER THE AGE OF 75
96.4/ 100
METRIC RATING
70th/ 347
METRIC RANK
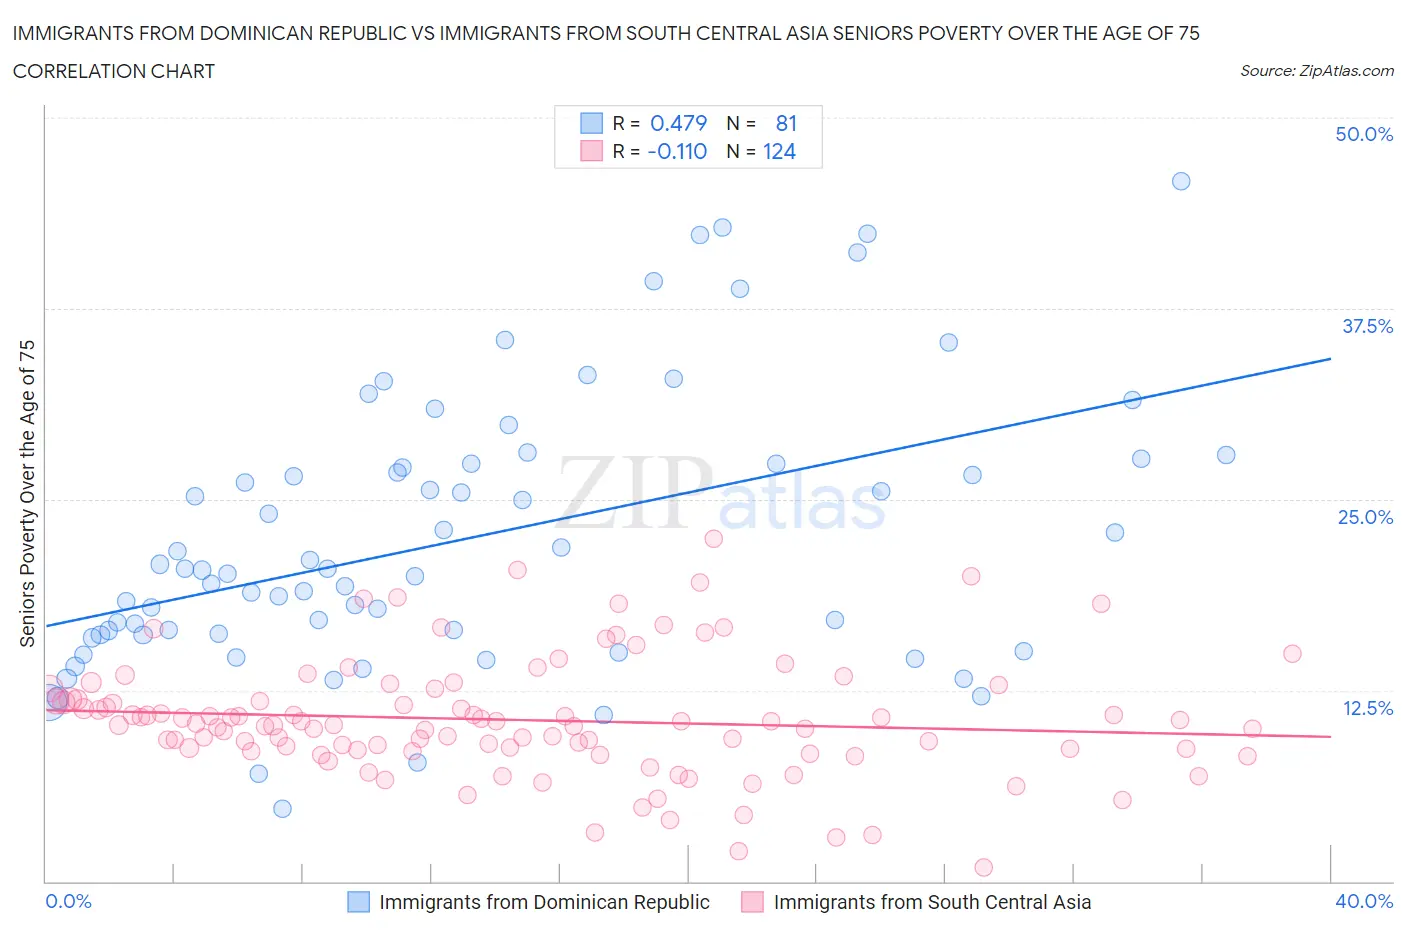
Immigrants from Dominican Republic vs Immigrants from South Central Asia Seniors Poverty Over the Age of 75 Correlation Chart
The statistical analysis conducted on geographies consisting of 272,640,242 people shows a moderate positive correlation between the proportion of Immigrants from Dominican Republic and poverty level among seniors over the age of 75 in the United States with a correlation coefficient (R) of 0.479 and weighted average of 20.1%. Similarly, the statistical analysis conducted on geographies consisting of 465,487,135 people shows a poor negative correlation between the proportion of Immigrants from South Central Asia and poverty level among seniors over the age of 75 in the United States with a correlation coefficient (R) of -0.110 and weighted average of 11.4%, a difference of 76.3%.
Seniors Poverty Over the Age of 75 Correlation Summary
| Measurement | Immigrants from Dominican Republic | Immigrants from South Central Asia |
| Minimum | 4.8% | 0.92% |
| Maximum | 45.8% | 22.4% |
| Range | 41.1% | 21.5% |
| Mean | 22.4% | 10.6% |
| Median | 20.3% | 10.2% |
| Interquartile 25% (IQ1) | 16.1% | 8.7% |
| Interquartile 75% (IQ3) | 27.3% | 11.9% |
| Interquartile Range (IQR) | 11.2% | 3.3% |
| Standard Deviation (Sample) | 9.0% | 3.9% |
| Standard Deviation (Population) | 8.9% | 3.8% |
Similar Demographics by Seniors Poverty Over the Age of 75
Demographics Similar to Immigrants from Dominican Republic by Seniors Poverty Over the Age of 75
In terms of seniors poverty over the age of 75, the demographic groups most similar to Immigrants from Dominican Republic are Immigrants from Cuba (19.9%, a difference of 0.78%), Lumbee (19.7%, a difference of 1.6%), Dominican (19.6%, a difference of 2.2%), Navajo (19.4%, a difference of 3.5%), and Tohono O'odham (19.1%, a difference of 4.8%).
| Demographics | Rating | Rank | Seniors Poverty Over the Age of 75 |
| Immigrants | Nicaragua | 0.0 /100 | #333 | Tragic 17.6% |
| Immigrants | Grenada | 0.0 /100 | #334 | Tragic 17.8% |
| Cubans | 0.0 /100 | #335 | Tragic 18.0% |
| Immigrants | Caribbean | 0.0 /100 | #336 | Tragic 18.2% |
| Yakama | 0.0 /100 | #337 | Tragic 18.3% |
| Immigrants | Cabo Verde | 0.0 /100 | #338 | Tragic 18.5% |
| Hopi | 0.0 /100 | #339 | Tragic 18.9% |
| Tohono O'odham | 0.0 /100 | #340 | Tragic 19.1% |
| Navajo | 0.0 /100 | #341 | Tragic 19.4% |
| Dominicans | 0.0 /100 | #342 | Tragic 19.6% |
| Lumbee | 0.0 /100 | #343 | Tragic 19.7% |
| Immigrants | Cuba | 0.0 /100 | #344 | Tragic 19.9% |
| Immigrants | Dominican Republic | 0.0 /100 | #345 | Tragic 20.1% |
| Puerto Ricans | 0.0 /100 | #346 | Tragic 23.2% |
| Pima | 0.0 /100 | #347 | Tragic 23.9% |
Demographics Similar to Immigrants from South Central Asia by Seniors Poverty Over the Age of 75
In terms of seniors poverty over the age of 75, the demographic groups most similar to Immigrants from South Central Asia are Ottawa (11.4%, a difference of 0.040%), Immigrants from Austria (11.4%, a difference of 0.050%), Bolivian (11.4%, a difference of 0.070%), Osage (11.4%, a difference of 0.080%), and Estonian (11.4%, a difference of 0.16%).
| Demographics | Rating | Rank | Seniors Poverty Over the Age of 75 |
| Immigrants | Afghanistan | 97.5 /100 | #63 | Exceptional 11.3% |
| Immigrants | Northern Europe | 97.4 /100 | #64 | Exceptional 11.3% |
| Immigrants | Taiwan | 96.7 /100 | #65 | Exceptional 11.4% |
| Estonians | 96.7 /100 | #66 | Exceptional 11.4% |
| Bolivians | 96.5 /100 | #67 | Exceptional 11.4% |
| Immigrants | Austria | 96.5 /100 | #68 | Exceptional 11.4% |
| Ottawa | 96.5 /100 | #69 | Exceptional 11.4% |
| Immigrants | South Central Asia | 96.4 /100 | #70 | Exceptional 11.4% |
| Osage | 96.3 /100 | #71 | Exceptional 11.4% |
| Sierra Leoneans | 96.1 /100 | #72 | Exceptional 11.4% |
| Immigrants | Micronesia | 96.0 /100 | #73 | Exceptional 11.4% |
| Delaware | 96.0 /100 | #74 | Exceptional 11.4% |
| Palestinians | 95.8 /100 | #75 | Exceptional 11.4% |
| French Canadians | 95.7 /100 | #76 | Exceptional 11.4% |
| Whites/Caucasians | 95.5 /100 | #77 | Exceptional 11.4% |