Immigrants from Denmark vs Swedish Female Poverty Among 18-24 Year Olds
COMPARE
Immigrants from Denmark
Swedish
Female Poverty Among 18-24 Year Olds
Female Poverty Among 18-24 Year Olds Comparison
Immigrants from Denmark
Swedes
20.8%
FEMALE POVERTY AMONG 18-24 YEAR OLDS
5.8/ 100
METRIC RATING
233rd/ 347
METRIC RANK
20.1%
FEMALE POVERTY AMONG 18-24 YEAR OLDS
50.0/ 100
METRIC RATING
174th/ 347
METRIC RANK
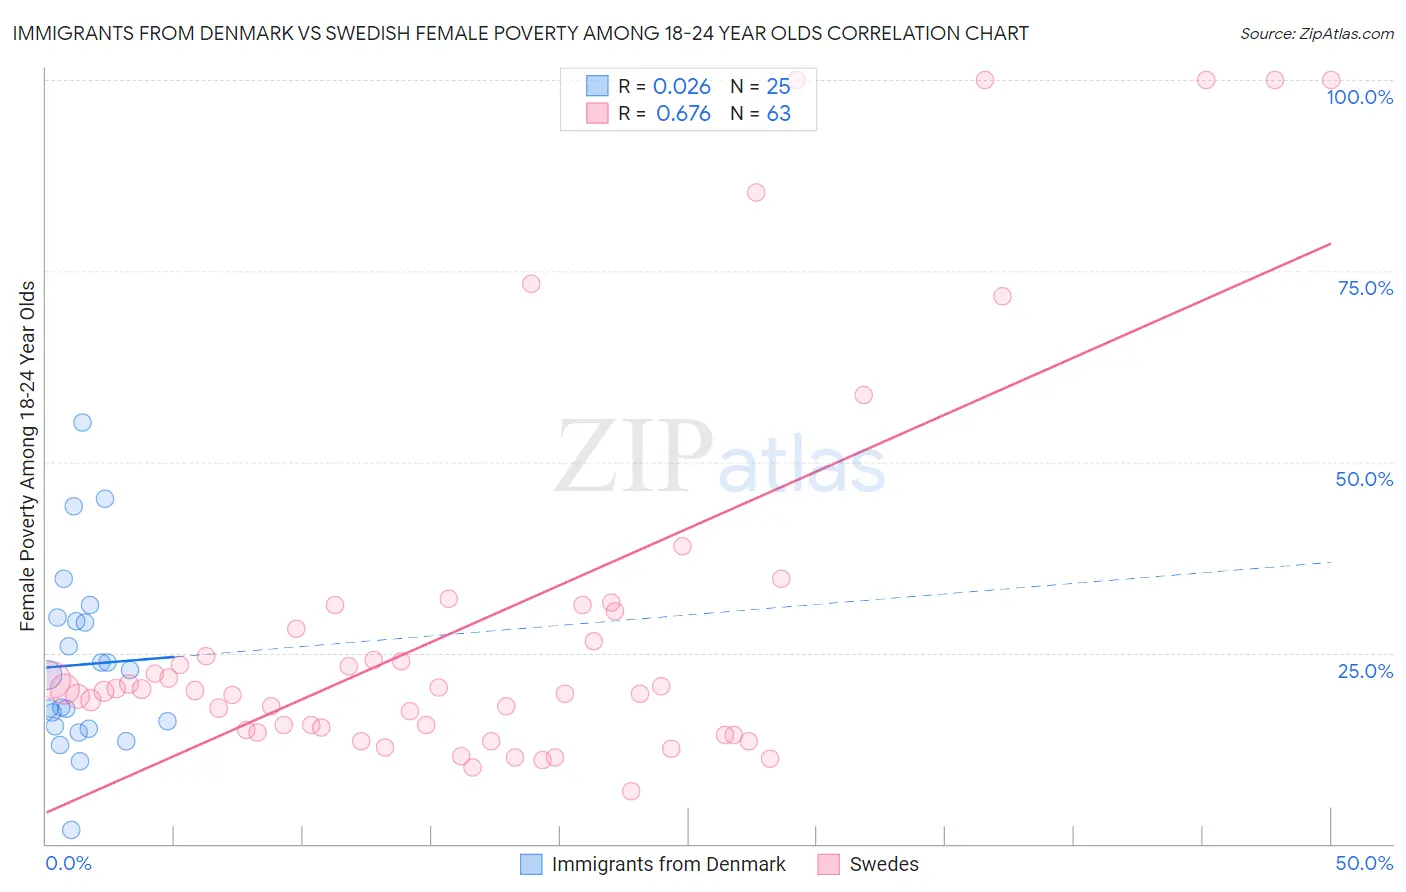
Immigrants from Denmark vs Swedish Female Poverty Among 18-24 Year Olds Correlation Chart
The statistical analysis conducted on geographies consisting of 134,710,219 people shows no correlation between the proportion of Immigrants from Denmark and poverty level among females between the ages 18 and 24 in the United States with a correlation coefficient (R) of 0.026 and weighted average of 20.8%. Similarly, the statistical analysis conducted on geographies consisting of 510,140,811 people shows a significant positive correlation between the proportion of Swedes and poverty level among females between the ages 18 and 24 in the United States with a correlation coefficient (R) of 0.676 and weighted average of 20.1%, a difference of 3.4%.
Female Poverty Among 18-24 Year Olds Correlation Summary
| Measurement | Immigrants from Denmark | Swedish |
| Minimum | 1.8% | 6.9% |
| Maximum | 55.2% | 100.0% |
| Range | 53.4% | 93.1% |
| Mean | 23.5% | 29.3% |
| Median | 22.1% | 20.2% |
| Interquartile 25% (IQ1) | 15.2% | 14.9% |
| Interquartile 75% (IQ3) | 29.4% | 30.4% |
| Interquartile Range (IQR) | 14.2% | 15.5% |
| Standard Deviation (Sample) | 12.0% | 25.5% |
| Standard Deviation (Population) | 11.8% | 25.3% |
Similar Demographics by Female Poverty Among 18-24 Year Olds
Demographics Similar to Immigrants from Denmark by Female Poverty Among 18-24 Year Olds
In terms of female poverty among 18-24 year olds, the demographic groups most similar to Immigrants from Denmark are Finnish (20.8%, a difference of 0.030%), Immigrants from St. Vincent and the Grenadines (20.8%, a difference of 0.040%), Australian (20.8%, a difference of 0.060%), White/Caucasian (20.8%, a difference of 0.060%), and Welsh (20.8%, a difference of 0.10%).
| Demographics | Rating | Rank | Female Poverty Among 18-24 Year Olds |
| Estonians | 7.2 /100 | #226 | Tragic 20.7% |
| Immigrants | Sweden | 6.8 /100 | #227 | Tragic 20.7% |
| Ghanaians | 6.5 /100 | #228 | Tragic 20.8% |
| Australians | 6.1 /100 | #229 | Tragic 20.8% |
| Whites/Caucasians | 6.1 /100 | #230 | Tragic 20.8% |
| Immigrants | St. Vincent and the Grenadines | 6.0 /100 | #231 | Tragic 20.8% |
| Finns | 6.0 /100 | #232 | Tragic 20.8% |
| Immigrants | Denmark | 5.8 /100 | #233 | Tragic 20.8% |
| Welsh | 5.4 /100 | #234 | Tragic 20.8% |
| Immigrants | Uganda | 5.1 /100 | #235 | Tragic 20.8% |
| Okinawans | 4.9 /100 | #236 | Tragic 20.8% |
| Scottish | 4.5 /100 | #237 | Tragic 20.9% |
| Immigrants | Singapore | 4.4 /100 | #238 | Tragic 20.9% |
| Immigrants | Guatemala | 4.3 /100 | #239 | Tragic 20.9% |
| Luxembourgers | 4.2 /100 | #240 | Tragic 20.9% |
Demographics Similar to Swedes by Female Poverty Among 18-24 Year Olds
In terms of female poverty among 18-24 year olds, the demographic groups most similar to Swedes are Irish (20.1%, a difference of 0.0%), South American Indian (20.1%, a difference of 0.080%), Belizean (20.1%, a difference of 0.10%), Immigrants from Nigeria (20.1%, a difference of 0.21%), and Iranian (20.1%, a difference of 0.23%).
| Demographics | Rating | Rank | Female Poverty Among 18-24 Year Olds |
| Czechoslovakians | 61.8 /100 | #167 | Good 20.0% |
| Fijians | 59.1 /100 | #168 | Average 20.0% |
| Hmong | 55.4 /100 | #169 | Average 20.0% |
| Iranians | 54.7 /100 | #170 | Average 20.1% |
| Immigrants | Nigeria | 54.3 /100 | #171 | Average 20.1% |
| Belizeans | 52.0 /100 | #172 | Average 20.1% |
| Irish | 50.0 /100 | #173 | Average 20.1% |
| Swedes | 50.0 /100 | #174 | Average 20.1% |
| South American Indians | 48.4 /100 | #175 | Average 20.1% |
| Kenyans | 44.9 /100 | #176 | Average 20.2% |
| Immigrants | Kazakhstan | 44.2 /100 | #177 | Average 20.2% |
| Swiss | 44.0 /100 | #178 | Average 20.2% |
| Ethiopians | 43.8 /100 | #179 | Average 20.2% |
| Iraqis | 43.3 /100 | #180 | Average 20.2% |
| Immigrants | China | 43.0 /100 | #181 | Average 20.2% |