Immigrants from Croatia vs Immigrants from Pakistan Male Poverty
COMPARE
Immigrants from Croatia
Immigrants from Pakistan
Male Poverty
Male Poverty Comparison
Immigrants from Croatia
Immigrants from Pakistan
10.0%
MALE POVERTY
98.7/ 100
METRIC RATING
51st/ 347
METRIC RANK
9.9%
MALE POVERTY
99.2/ 100
METRIC RATING
38th/ 347
METRIC RANK
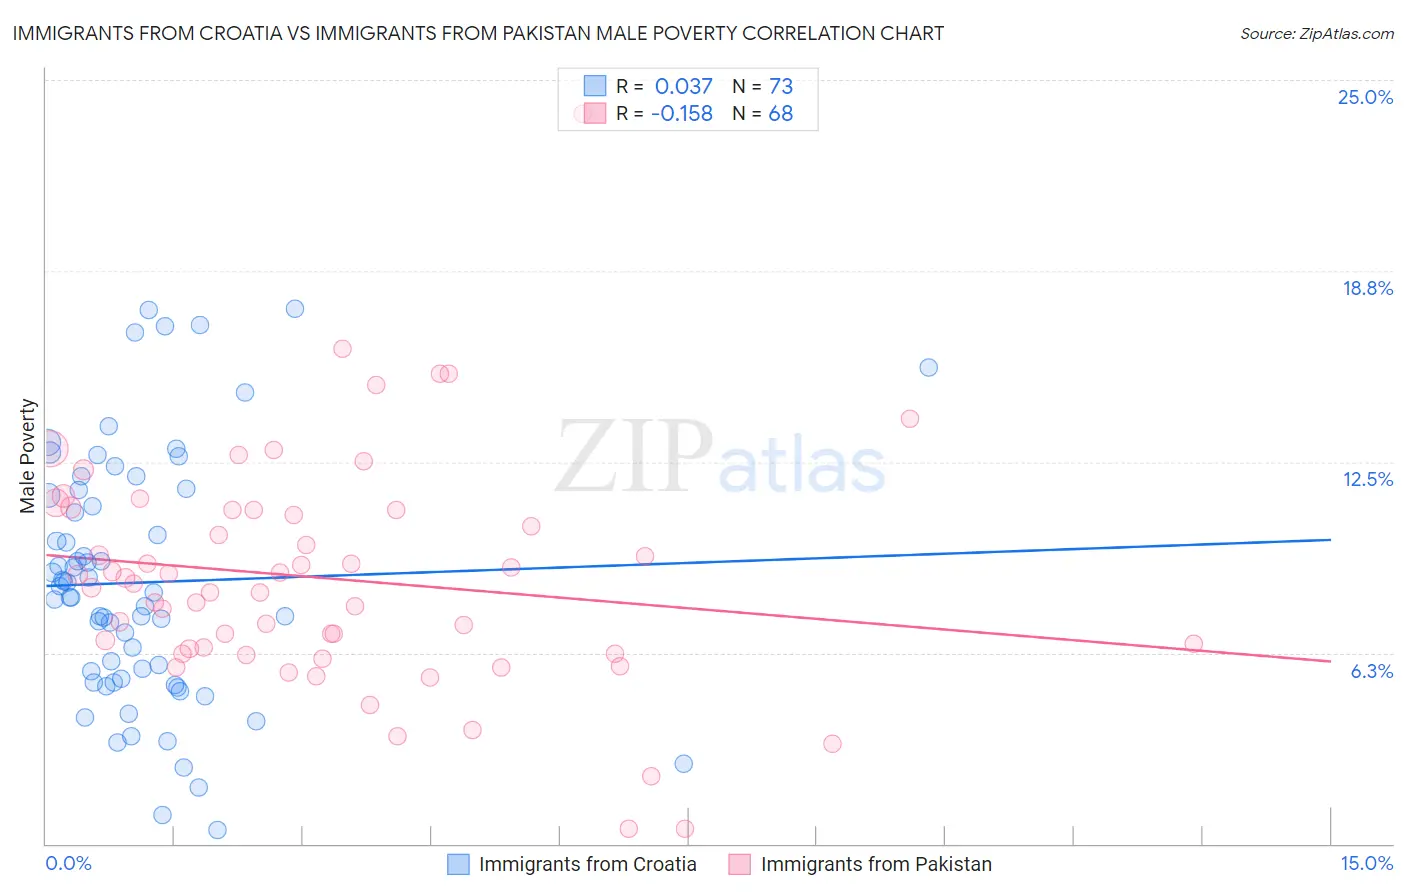
Immigrants from Croatia vs Immigrants from Pakistan Male Poverty Correlation Chart
The statistical analysis conducted on geographies consisting of 132,552,240 people shows no correlation between the proportion of Immigrants from Croatia and poverty level among males in the United States with a correlation coefficient (R) of 0.037 and weighted average of 10.0%. Similarly, the statistical analysis conducted on geographies consisting of 283,757,026 people shows a poor negative correlation between the proportion of Immigrants from Pakistan and poverty level among males in the United States with a correlation coefficient (R) of -0.158 and weighted average of 9.9%, a difference of 1.5%.
Male Poverty Correlation Summary
| Measurement | Immigrants from Croatia | Immigrants from Pakistan |
| Minimum | 0.43% | 0.49% |
| Maximum | 17.5% | 23.9% |
| Range | 17.1% | 23.4% |
| Mean | 8.6% | 8.7% |
| Median | 8.2% | 8.5% |
| Interquartile 25% (IQ1) | 5.3% | 6.3% |
| Interquartile 75% (IQ3) | 11.5% | 10.9% |
| Interquartile Range (IQR) | 6.2% | 4.6% |
| Standard Deviation (Sample) | 4.1% | 3.8% |
| Standard Deviation (Population) | 4.0% | 3.8% |
Demographics Similar to Immigrants from Croatia and Immigrants from Pakistan by Male Poverty
In terms of male poverty, the demographic groups most similar to Immigrants from Croatia are Asian (10.0%, a difference of 0.090%), Immigrants from Philippines (10.0%, a difference of 0.10%), Slovene (10.0%, a difference of 0.16%), Immigrants from Czechoslovakia (10.0%, a difference of 0.16%), and Immigrants from Singapore (10.0%, a difference of 0.25%). Similarly, the demographic groups most similar to Immigrants from Pakistan are Russian (9.9%, a difference of 0.010%), Cypriot (9.9%, a difference of 0.090%), Korean (9.9%, a difference of 0.18%), Immigrants from Greece (9.8%, a difference of 0.37%), and Immigrants from Iran (9.9%, a difference of 0.42%).
| Demographics | Rating | Rank | Male Poverty |
| Immigrants | Poland | 99.5 /100 | #34 | Exceptional 9.8% |
| Iranians | 99.4 /100 | #35 | Exceptional 9.8% |
| Czechs | 99.4 /100 | #36 | Exceptional 9.8% |
| Immigrants | Greece | 99.3 /100 | #37 | Exceptional 9.8% |
| Immigrants | Pakistan | 99.2 /100 | #38 | Exceptional 9.9% |
| Russians | 99.2 /100 | #39 | Exceptional 9.9% |
| Cypriots | 99.2 /100 | #40 | Exceptional 9.9% |
| Koreans | 99.2 /100 | #41 | Exceptional 9.9% |
| Immigrants | Iran | 99.1 /100 | #42 | Exceptional 9.9% |
| Immigrants | Moldova | 99.0 /100 | #43 | Exceptional 9.9% |
| Immigrants | Romania | 98.9 /100 | #44 | Exceptional 9.9% |
| Immigrants | Serbia | 98.9 /100 | #45 | Exceptional 10.0% |
| Turks | 98.9 /100 | #46 | Exceptional 10.0% |
| Immigrants | Singapore | 98.8 /100 | #47 | Exceptional 10.0% |
| Immigrants | Japan | 98.8 /100 | #48 | Exceptional 10.0% |
| Slovenes | 98.8 /100 | #49 | Exceptional 10.0% |
| Immigrants | Philippines | 98.7 /100 | #50 | Exceptional 10.0% |
| Immigrants | Croatia | 98.7 /100 | #51 | Exceptional 10.0% |
| Asians | 98.7 /100 | #52 | Exceptional 10.0% |
| Immigrants | Czechoslovakia | 98.6 /100 | #53 | Exceptional 10.0% |
| Immigrants | Austria | 98.5 /100 | #54 | Exceptional 10.0% |