Immigrants from Colombia vs Immigrants from Western Europe Male Poverty
COMPARE
Immigrants from Colombia
Immigrants from Western Europe
Male Poverty
Male Poverty Comparison
Immigrants from Colombia
Immigrants from Western Europe
11.1%
MALE POVERTY
54.2/ 100
METRIC RATING
169th/ 347
METRIC RANK
10.7%
MALE POVERTY
84.2/ 100
METRIC RATING
128th/ 347
METRIC RANK
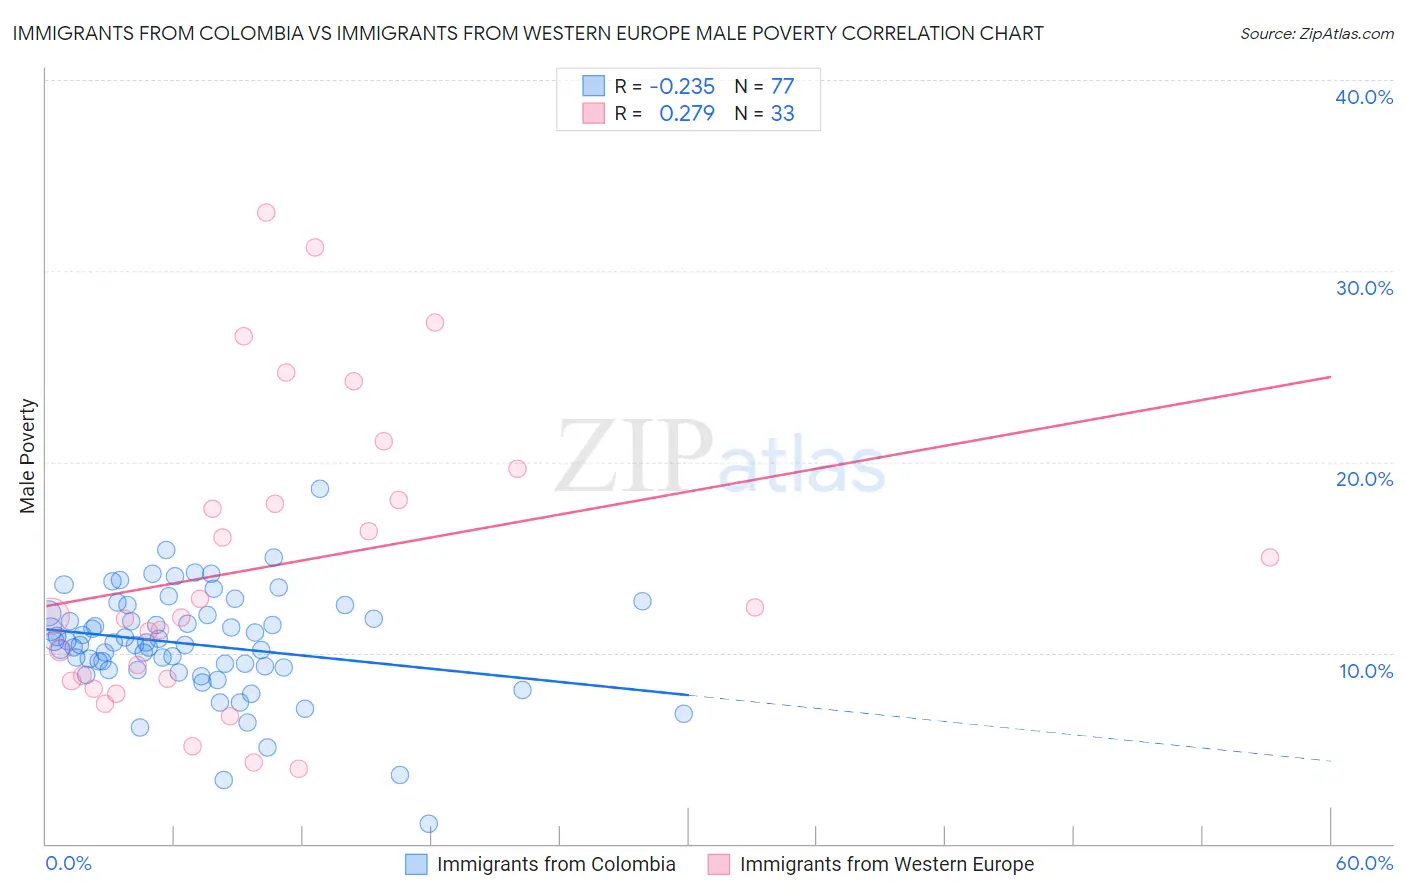
Immigrants from Colombia vs Immigrants from Western Europe Male Poverty Correlation Chart
The statistical analysis conducted on geographies consisting of 378,363,943 people shows a weak negative correlation between the proportion of Immigrants from Colombia and poverty level among males in the United States with a correlation coefficient (R) of -0.235 and weighted average of 11.1%. Similarly, the statistical analysis conducted on geographies consisting of 493,468,603 people shows a weak positive correlation between the proportion of Immigrants from Western Europe and poverty level among males in the United States with a correlation coefficient (R) of 0.279 and weighted average of 10.7%, a difference of 3.8%.
Male Poverty Correlation Summary
| Measurement | Immigrants from Colombia | Immigrants from Western Europe |
| Minimum | 1.0% | 3.9% |
| Maximum | 18.6% | 33.1% |
| Range | 17.5% | 29.2% |
| Mean | 10.4% | 14.6% |
| Median | 10.5% | 11.9% |
| Interquartile 25% (IQ1) | 9.2% | 8.6% |
| Interquartile 75% (IQ3) | 12.0% | 18.8% |
| Interquartile Range (IQR) | 2.8% | 10.2% |
| Standard Deviation (Sample) | 2.8% | 7.8% |
| Standard Deviation (Population) | 2.8% | 7.7% |
Similar Demographics by Male Poverty
Demographics Similar to Immigrants from Colombia by Male Poverty
In terms of male poverty, the demographic groups most similar to Immigrants from Colombia are South American (11.1%, a difference of 0.040%), Immigrants from Portugal (11.1%, a difference of 0.070%), Hungarian (11.1%, a difference of 0.090%), Immigrants from Albania (11.1%, a difference of 0.11%), and Immigrants from Spain (11.1%, a difference of 0.13%).
| Demographics | Rating | Rank | Male Poverty |
| Immigrants | Chile | 57.4 /100 | #162 | Average 11.1% |
| Whites/Caucasians | 56.7 /100 | #163 | Average 11.1% |
| Ethiopians | 56.7 /100 | #164 | Average 11.1% |
| Immigrants | Spain | 55.5 /100 | #165 | Average 11.1% |
| Immigrants | Albania | 55.3 /100 | #166 | Average 11.1% |
| Hungarians | 55.1 /100 | #167 | Average 11.1% |
| Immigrants | Portugal | 54.9 /100 | #168 | Average 11.1% |
| Immigrants | Colombia | 54.2 /100 | #169 | Average 11.1% |
| South Americans | 53.8 /100 | #170 | Average 11.1% |
| Uruguayans | 51.0 /100 | #171 | Average 11.2% |
| Immigrants | Ethiopia | 50.7 /100 | #172 | Average 11.2% |
| Pennsylvania Germans | 50.5 /100 | #173 | Average 11.2% |
| Immigrants | Oceania | 50.0 /100 | #174 | Average 11.2% |
| Celtics | 47.5 /100 | #175 | Average 11.2% |
| Immigrants | Fiji | 46.0 /100 | #176 | Average 11.2% |
Demographics Similar to Immigrants from Western Europe by Male Poverty
In terms of male poverty, the demographic groups most similar to Immigrants from Western Europe are Immigrants from Peru (10.7%, a difference of 0.010%), Immigrants from Ukraine (10.7%, a difference of 0.020%), Puget Sound Salish (10.7%, a difference of 0.020%), Chilean (10.7%, a difference of 0.060%), and Immigrants from Belarus (10.7%, a difference of 0.17%).
| Demographics | Rating | Rank | Male Poverty |
| Peruvians | 87.1 /100 | #121 | Excellent 10.7% |
| Native Hawaiians | 87.0 /100 | #122 | Excellent 10.7% |
| South Africans | 86.8 /100 | #123 | Excellent 10.7% |
| French | 86.7 /100 | #124 | Excellent 10.7% |
| Immigrants | Norway | 86.0 /100 | #125 | Excellent 10.7% |
| Immigrants | Ukraine | 84.3 /100 | #126 | Excellent 10.7% |
| Puget Sound Salish | 84.3 /100 | #127 | Excellent 10.7% |
| Immigrants | Western Europe | 84.2 /100 | #128 | Excellent 10.7% |
| Immigrants | Peru | 84.1 /100 | #129 | Excellent 10.7% |
| Chileans | 83.9 /100 | #130 | Excellent 10.7% |
| Immigrants | Belarus | 83.3 /100 | #131 | Excellent 10.7% |
| Immigrants | Vietnam | 83.0 /100 | #132 | Excellent 10.8% |
| Pakistanis | 83.0 /100 | #133 | Excellent 10.8% |
| New Zealanders | 82.9 /100 | #134 | Excellent 10.8% |
| Brazilians | 82.7 /100 | #135 | Excellent 10.8% |