Immigrants from Central America vs Serbian Child Poverty Among Girls Under 16
COMPARE
Immigrants from Central America
Serbian
Child Poverty Among Girls Under 16
Child Poverty Among Girls Under 16 Comparison
Immigrants from Central America
Serbians
21.4%
CHILD POVERTY AMONG GIRLS UNDER 16
0.0/ 100
METRIC RATING
306th/ 347
METRIC RANK
15.1%
CHILD POVERTY AMONG GIRLS UNDER 16
94.8/ 100
METRIC RATING
109th/ 347
METRIC RANK
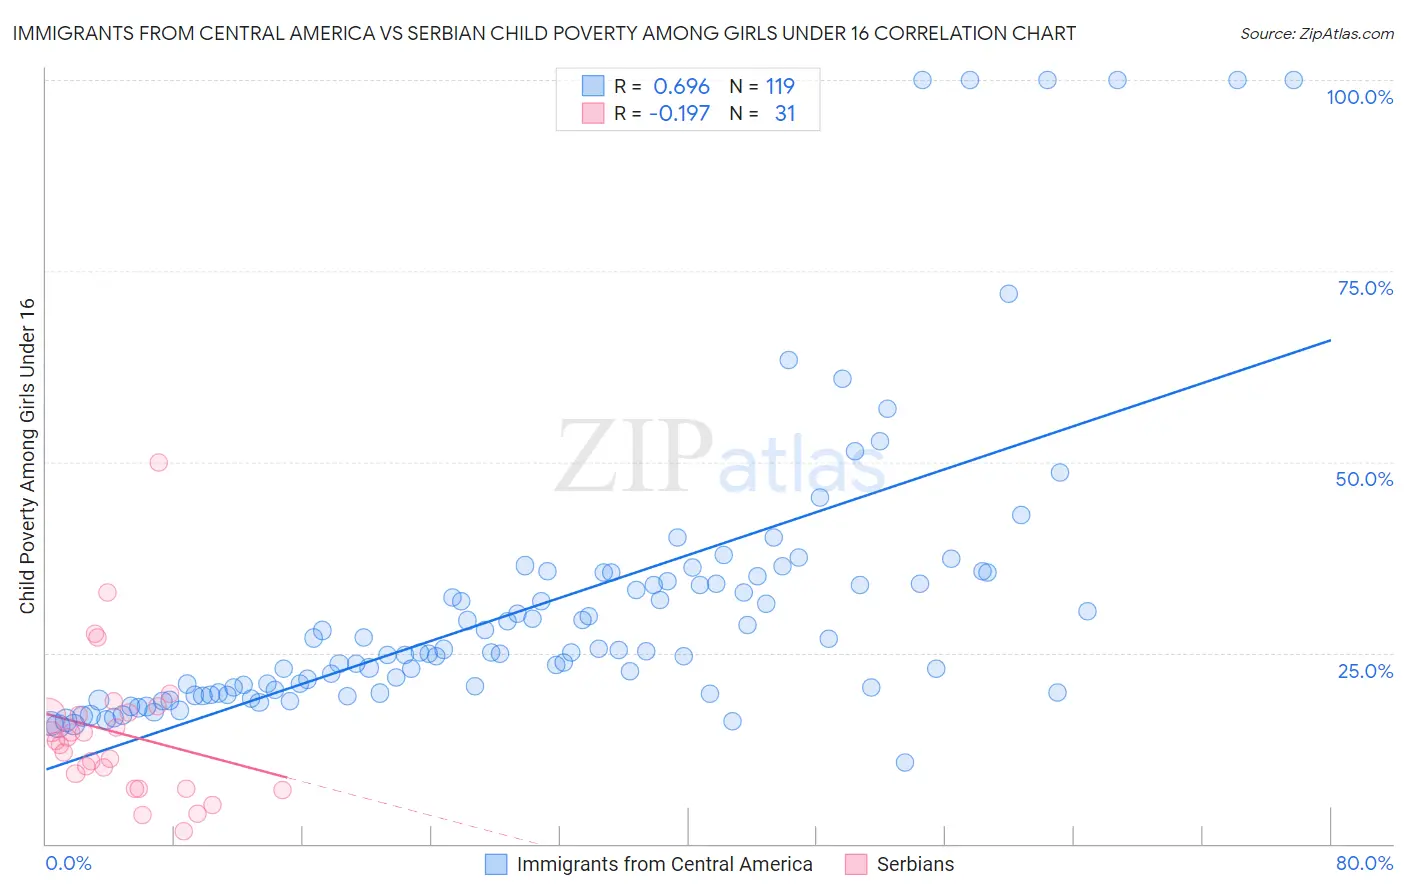
Immigrants from Central America vs Serbian Child Poverty Among Girls Under 16 Correlation Chart
The statistical analysis conducted on geographies consisting of 521,407,533 people shows a significant positive correlation between the proportion of Immigrants from Central America and poverty level among girls under the age of 16 in the United States with a correlation coefficient (R) of 0.696 and weighted average of 21.4%. Similarly, the statistical analysis conducted on geographies consisting of 263,517,669 people shows a poor negative correlation between the proportion of Serbians and poverty level among girls under the age of 16 in the United States with a correlation coefficient (R) of -0.197 and weighted average of 15.1%, a difference of 42.0%.
Child Poverty Among Girls Under 16 Correlation Summary
| Measurement | Immigrants from Central America | Serbian |
| Minimum | 10.7% | 1.6% |
| Maximum | 100.0% | 50.0% |
| Range | 89.3% | 48.4% |
| Mean | 31.3% | 14.5% |
| Median | 25.1% | 13.4% |
| Interquartile 25% (IQ1) | 19.7% | 7.2% |
| Interquartile 75% (IQ3) | 34.4% | 17.1% |
| Interquartile Range (IQR) | 14.7% | 9.9% |
| Standard Deviation (Sample) | 19.0% | 9.7% |
| Standard Deviation (Population) | 19.0% | 9.5% |
Similar Demographics by Child Poverty Among Girls Under 16
Demographics Similar to Immigrants from Central America by Child Poverty Among Girls Under 16
In terms of child poverty among girls under 16, the demographic groups most similar to Immigrants from Central America are Immigrants from Bahamas (21.4%, a difference of 0.010%), Guatemalan (21.4%, a difference of 0.17%), Houma (21.5%, a difference of 0.19%), Bahamian (21.5%, a difference of 0.31%), and Immigrants from Somalia (21.6%, a difference of 0.58%).
| Demographics | Rating | Rank | Child Poverty Among Girls Under 16 |
| Hispanics or Latinos | 0.0 /100 | #299 | Tragic 21.0% |
| Somalis | 0.0 /100 | #300 | Tragic 21.0% |
| Choctaw | 0.0 /100 | #301 | Tragic 21.1% |
| Seminole | 0.0 /100 | #302 | Tragic 21.2% |
| British West Indians | 0.0 /100 | #303 | Tragic 21.3% |
| Indonesians | 0.0 /100 | #304 | Tragic 21.3% |
| Guatemalans | 0.0 /100 | #305 | Tragic 21.4% |
| Immigrants | Central America | 0.0 /100 | #306 | Tragic 21.4% |
| Immigrants | Bahamas | 0.0 /100 | #307 | Tragic 21.4% |
| Houma | 0.0 /100 | #308 | Tragic 21.5% |
| Bahamians | 0.0 /100 | #309 | Tragic 21.5% |
| Immigrants | Somalia | 0.0 /100 | #310 | Tragic 21.6% |
| Dutch West Indians | 0.0 /100 | #311 | Tragic 21.6% |
| Immigrants | Mexico | 0.0 /100 | #312 | Tragic 21.6% |
| Creek | 0.0 /100 | #313 | Tragic 21.7% |
Demographics Similar to Serbians by Child Poverty Among Girls Under 16
In terms of child poverty among girls under 16, the demographic groups most similar to Serbians are Immigrants from Brazil (15.1%, a difference of 0.080%), Immigrants from Croatia (15.1%, a difference of 0.12%), Immigrants from Ukraine (15.1%, a difference of 0.16%), Palestinian (15.1%, a difference of 0.16%), and Chilean (15.1%, a difference of 0.22%).
| Demographics | Rating | Rank | Child Poverty Among Girls Under 16 |
| Immigrants | Malaysia | 95.6 /100 | #102 | Exceptional 15.0% |
| British | 95.6 /100 | #103 | Exceptional 15.0% |
| Romanians | 95.3 /100 | #104 | Exceptional 15.0% |
| Immigrants | England | 95.1 /100 | #105 | Exceptional 15.1% |
| Chileans | 95.1 /100 | #106 | Exceptional 15.1% |
| Immigrants | Ukraine | 95.0 /100 | #107 | Exceptional 15.1% |
| Immigrants | Brazil | 94.9 /100 | #108 | Exceptional 15.1% |
| Serbians | 94.8 /100 | #109 | Exceptional 15.1% |
| Immigrants | Croatia | 94.6 /100 | #110 | Exceptional 15.1% |
| Palestinians | 94.5 /100 | #111 | Exceptional 15.1% |
| Immigrants | Kazakhstan | 94.3 /100 | #112 | Exceptional 15.1% |
| Dutch | 94.3 /100 | #113 | Exceptional 15.1% |
| Sri Lankans | 94.0 /100 | #114 | Exceptional 15.2% |
| Belgians | 93.9 /100 | #115 | Exceptional 15.2% |
| Immigrants | Denmark | 93.3 /100 | #116 | Exceptional 15.2% |