Immigrants from Canada vs Yuman Female Poverty Among 25-34 Year Olds
COMPARE
Immigrants from Canada
Yuman
Female Poverty Among 25-34 Year Olds
Female Poverty Among 25-34 Year Olds Comparison
Immigrants from Canada
Yuman
12.9%
FEMALE POVERTY AMONG 25-34 YEAR OLDS
91.5/ 100
METRIC RATING
125th/ 347
METRIC RANK
22.9%
FEMALE POVERTY AMONG 25-34 YEAR OLDS
0.0/ 100
METRIC RATING
339th/ 347
METRIC RANK
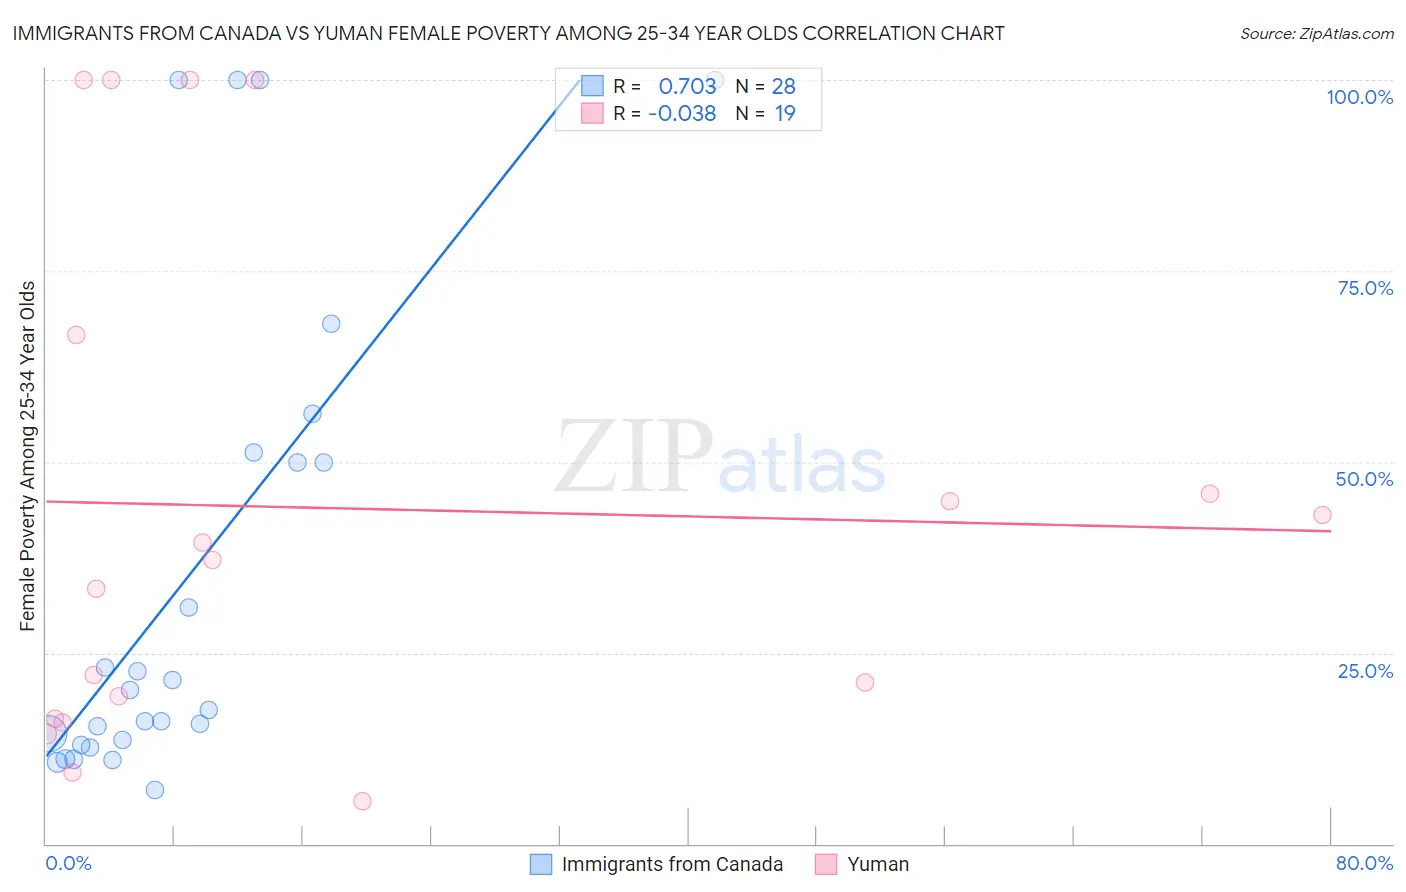
Immigrants from Canada vs Yuman Female Poverty Among 25-34 Year Olds Correlation Chart
The statistical analysis conducted on geographies consisting of 448,185,141 people shows a strong positive correlation between the proportion of Immigrants from Canada and poverty level among females between the ages 25 and 34 in the United States with a correlation coefficient (R) of 0.703 and weighted average of 12.9%. Similarly, the statistical analysis conducted on geographies consisting of 40,634,660 people shows no correlation between the proportion of Yuman and poverty level among females between the ages 25 and 34 in the United States with a correlation coefficient (R) of -0.038 and weighted average of 22.9%, a difference of 78.1%.
Female Poverty Among 25-34 Year Olds Correlation Summary
| Measurement | Immigrants from Canada | Yuman |
| Minimum | 7.1% | 5.6% |
| Maximum | 100.0% | 100.0% |
| Range | 92.9% | 94.4% |
| Mean | 35.0% | 43.9% |
| Median | 18.8% | 37.2% |
| Interquartile 25% (IQ1) | 13.3% | 16.4% |
| Interquartile 75% (IQ3) | 50.6% | 66.7% |
| Interquartile Range (IQR) | 37.3% | 50.3% |
| Standard Deviation (Sample) | 31.4% | 33.3% |
| Standard Deviation (Population) | 30.8% | 32.4% |
Similar Demographics by Female Poverty Among 25-34 Year Olds
Demographics Similar to Immigrants from Canada by Female Poverty Among 25-34 Year Olds
In terms of female poverty among 25-34 year olds, the demographic groups most similar to Immigrants from Canada are Immigrants from Fiji (12.9%, a difference of 0.080%), Immigrants from Netherlands (12.8%, a difference of 0.15%), Czech (12.9%, a difference of 0.32%), Syrian (12.9%, a difference of 0.33%), and Slovene (12.8%, a difference of 0.37%).
| Demographics | Rating | Rank | Female Poverty Among 25-34 Year Olds |
| Mongolians | 93.0 /100 | #118 | Exceptional 12.8% |
| Immigrants | Nepal | 93.0 /100 | #119 | Exceptional 12.8% |
| Carpatho Rusyns | 93.0 /100 | #120 | Exceptional 12.8% |
| Romanians | 92.8 /100 | #121 | Exceptional 12.8% |
| Immigrants | Western Asia | 92.7 /100 | #122 | Exceptional 12.8% |
| Slovenes | 92.7 /100 | #123 | Exceptional 12.8% |
| Immigrants | Netherlands | 92.0 /100 | #124 | Exceptional 12.8% |
| Immigrants | Canada | 91.5 /100 | #125 | Exceptional 12.9% |
| Immigrants | Fiji | 91.2 /100 | #126 | Exceptional 12.9% |
| Czechs | 90.3 /100 | #127 | Exceptional 12.9% |
| Syrians | 90.2 /100 | #128 | Exceptional 12.9% |
| Immigrants | North America | 89.7 /100 | #129 | Excellent 12.9% |
| Immigrants | Uzbekistan | 89.6 /100 | #130 | Excellent 12.9% |
| Pakistanis | 88.4 /100 | #131 | Excellent 13.0% |
| Immigrants | Hungary | 88.3 /100 | #132 | Excellent 13.0% |
Demographics Similar to Yuman by Female Poverty Among 25-34 Year Olds
In terms of female poverty among 25-34 year olds, the demographic groups most similar to Yuman are Sioux (23.0%, a difference of 0.18%), Houma (22.7%, a difference of 0.85%), Crow (22.7%, a difference of 1.0%), Navajo (23.3%, a difference of 1.9%), and Hopi (23.7%, a difference of 3.3%).
| Demographics | Rating | Rank | Female Poverty Among 25-34 Year Olds |
| Immigrants | Yemen | 0.0 /100 | #332 | Tragic 19.8% |
| Cajuns | 0.0 /100 | #333 | Tragic 19.9% |
| Apache | 0.0 /100 | #334 | Tragic 20.1% |
| Natives/Alaskans | 0.0 /100 | #335 | Tragic 20.3% |
| Pueblo | 0.0 /100 | #336 | Tragic 22.2% |
| Crow | 0.0 /100 | #337 | Tragic 22.7% |
| Houma | 0.0 /100 | #338 | Tragic 22.7% |
| Yuman | 0.0 /100 | #339 | Tragic 22.9% |
| Sioux | 0.0 /100 | #340 | Tragic 23.0% |
| Navajo | 0.0 /100 | #341 | Tragic 23.3% |
| Hopi | 0.0 /100 | #342 | Tragic 23.7% |
| Yup'ik | 0.0 /100 | #343 | Tragic 24.3% |
| Tohono O'odham | 0.0 /100 | #344 | Tragic 24.7% |
| Pima | 0.0 /100 | #345 | Tragic 25.3% |
| Lumbee | 0.0 /100 | #346 | Tragic 26.3% |