Immigrants from Canada vs Cambodian Single Father Poverty
COMPARE
Immigrants from Canada
Cambodian
Single Father Poverty
Single Father Poverty Comparison
Immigrants from Canada
Cambodians
16.5%
SINGLE FATHER POVERTY
21.9/ 100
METRIC RATING
196th/ 347
METRIC RANK
16.4%
SINGLE FATHER POVERTY
34.6/ 100
METRIC RATING
184th/ 347
METRIC RANK
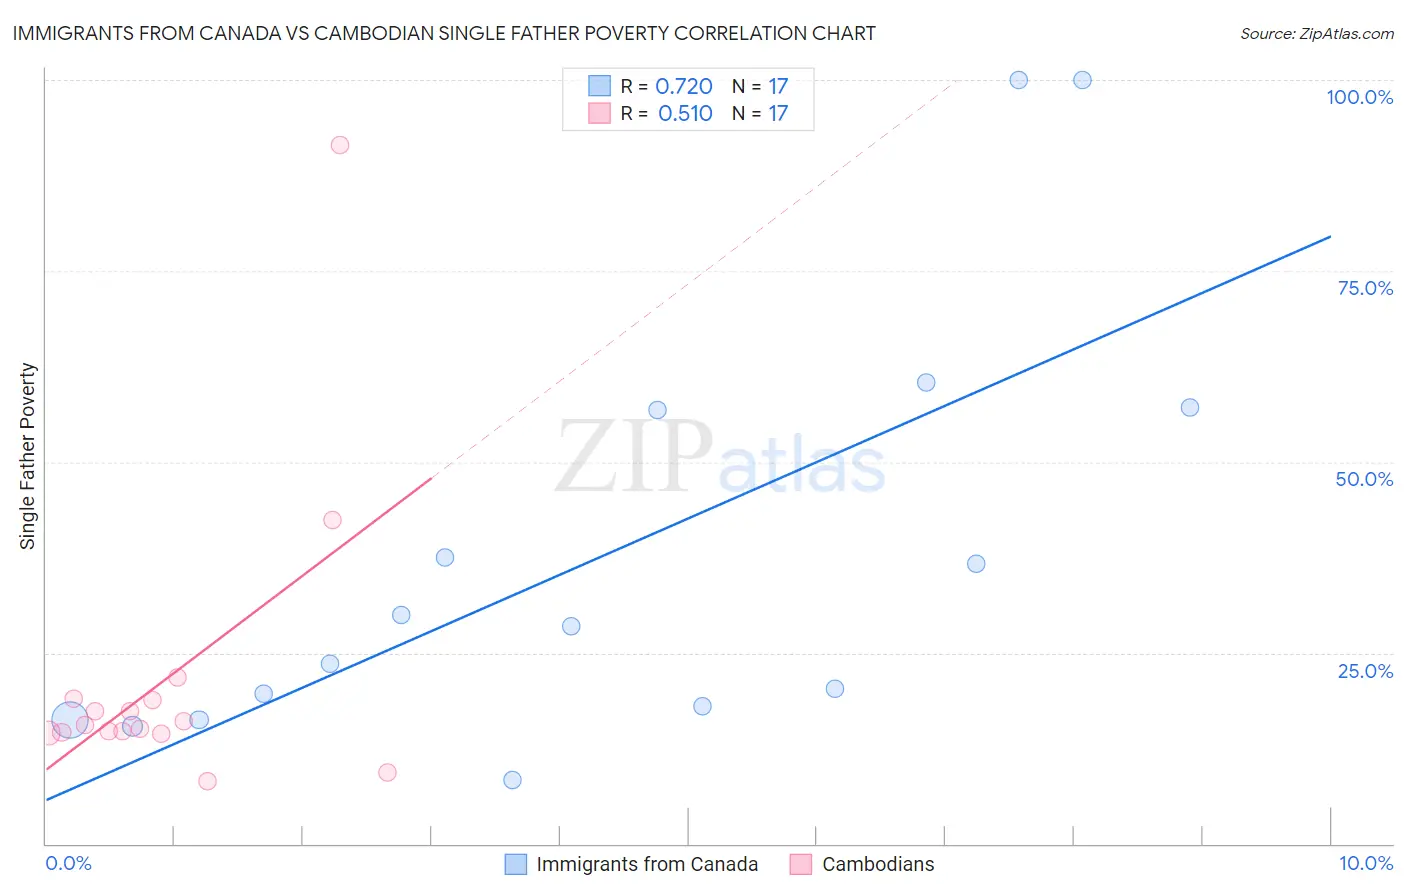
Immigrants from Canada vs Cambodian Single Father Poverty Correlation Chart
The statistical analysis conducted on geographies consisting of 347,419,276 people shows a strong positive correlation between the proportion of Immigrants from Canada and poverty level among single fathers in the United States with a correlation coefficient (R) of 0.720 and weighted average of 16.5%. Similarly, the statistical analysis conducted on geographies consisting of 91,317,365 people shows a substantial positive correlation between the proportion of Cambodians and poverty level among single fathers in the United States with a correlation coefficient (R) of 0.510 and weighted average of 16.4%, a difference of 0.70%.
Single Father Poverty Correlation Summary
| Measurement | Immigrants from Canada | Cambodian |
| Minimum | 8.4% | 8.1% |
| Maximum | 100.0% | 91.5% |
| Range | 91.6% | 83.4% |
| Mean | 37.9% | 21.5% |
| Median | 28.5% | 15.6% |
| Interquartile 25% (IQ1) | 17.1% | 14.5% |
| Interquartile 75% (IQ3) | 57.0% | 18.9% |
| Interquartile Range (IQR) | 39.9% | 4.4% |
| Standard Deviation (Sample) | 28.1% | 19.5% |
| Standard Deviation (Population) | 27.3% | 18.9% |
Demographics Similar to Immigrants from Canada and Cambodians by Single Father Poverty
In terms of single father poverty, the demographic groups most similar to Immigrants from Canada are Immigrants from Northern Europe (16.5%, a difference of 0.11%), Romanian (16.5%, a difference of 0.12%), Immigrants from Belize (16.5%, a difference of 0.14%), Cape Verdean (16.5%, a difference of 0.15%), and Immigrants from Barbados (16.5%, a difference of 0.15%). Similarly, the demographic groups most similar to Cambodians are Aleut (16.4%, a difference of 0.030%), Immigrants from Italy (16.4%, a difference of 0.050%), Panamanian (16.4%, a difference of 0.050%), Immigrants from Western Africa (16.4%, a difference of 0.060%), and Immigrants from Latin America (16.4%, a difference of 0.12%).
| Demographics | Rating | Rank | Single Father Poverty |
| Immigrants | Latin America | 37.2 /100 | #180 | Fair 16.4% |
| Immigrants | Western Africa | 36.0 /100 | #181 | Fair 16.4% |
| Immigrants | Italy | 35.7 /100 | #182 | Fair 16.4% |
| Aleuts | 35.3 /100 | #183 | Fair 16.4% |
| Cambodians | 34.6 /100 | #184 | Fair 16.4% |
| Panamanians | 33.6 /100 | #185 | Fair 16.4% |
| Immigrants | Venezuela | 31.0 /100 | #186 | Fair 16.4% |
| Ukrainians | 30.4 /100 | #187 | Fair 16.4% |
| Russians | 30.1 /100 | #188 | Fair 16.4% |
| Latvians | 28.9 /100 | #189 | Fair 16.5% |
| Immigrants | Burma/Myanmar | 28.0 /100 | #190 | Fair 16.5% |
| Immigrants | Guyana | 27.1 /100 | #191 | Fair 16.5% |
| Immigrants | Switzerland | 24.8 /100 | #192 | Fair 16.5% |
| Ecuadorians | 24.5 /100 | #193 | Fair 16.5% |
| Cape Verdeans | 24.4 /100 | #194 | Fair 16.5% |
| Immigrants | Barbados | 24.3 /100 | #195 | Fair 16.5% |
| Immigrants | Canada | 21.9 /100 | #196 | Fair 16.5% |
| Immigrants | Northern Europe | 20.3 /100 | #197 | Fair 16.5% |
| Romanians | 20.1 /100 | #198 | Fair 16.5% |
| Immigrants | Belize | 19.8 /100 | #199 | Poor 16.5% |
| Syrians | 17.4 /100 | #200 | Poor 16.6% |