Immigrants from Canada vs Armenian Single Father Poverty
COMPARE
Immigrants from Canada
Armenian
Single Father Poverty
Single Father Poverty Comparison
Immigrants from Canada
Armenians
16.5%
SINGLE FATHER POVERTY
21.9/ 100
METRIC RATING
196th/ 347
METRIC RANK
15.4%
SINGLE FATHER POVERTY
99.4/ 100
METRIC RATING
80th/ 347
METRIC RANK
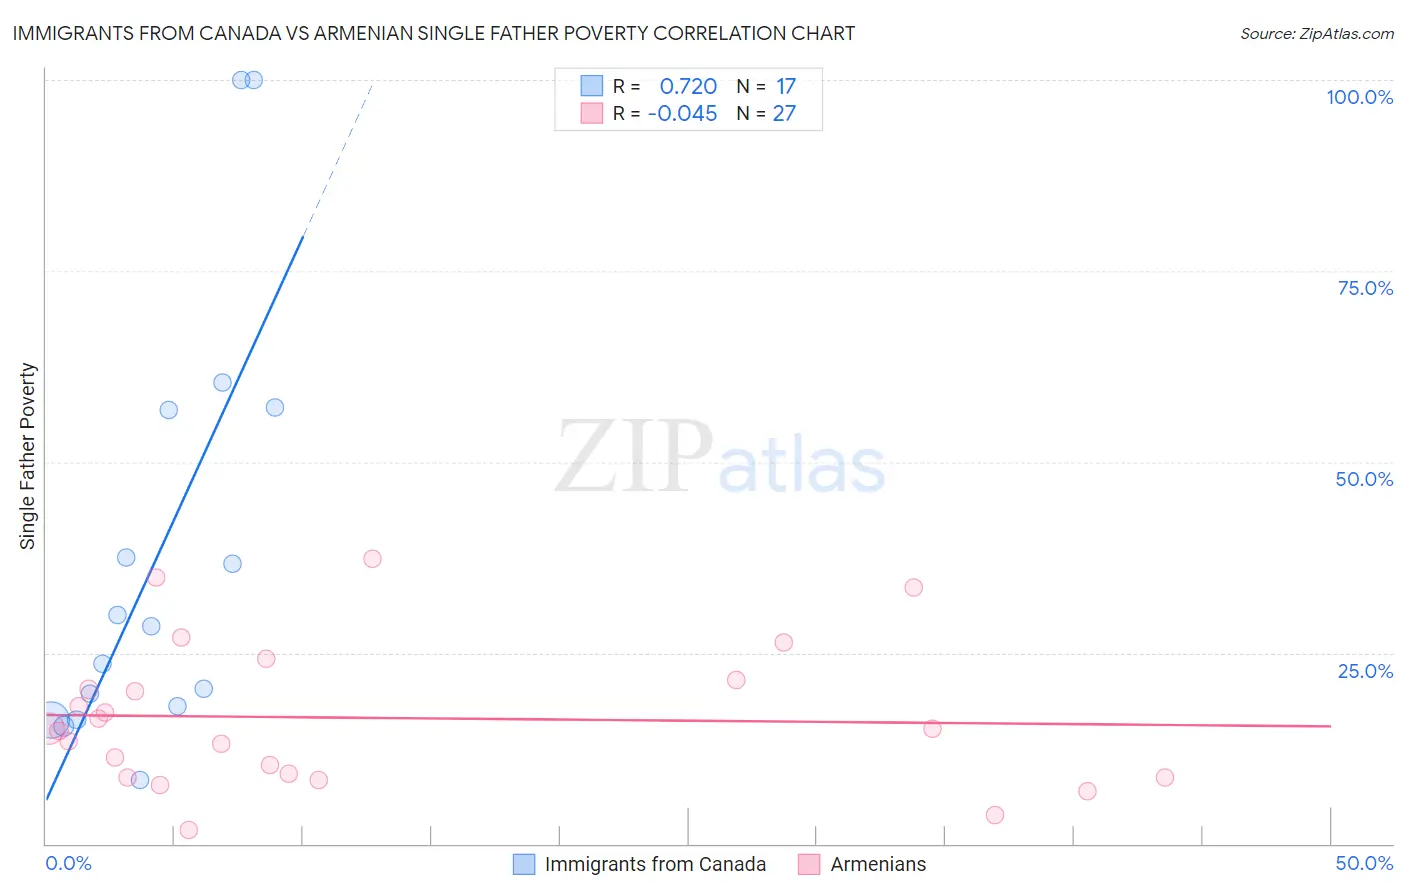
Immigrants from Canada vs Armenian Single Father Poverty Correlation Chart
The statistical analysis conducted on geographies consisting of 347,419,276 people shows a strong positive correlation between the proportion of Immigrants from Canada and poverty level among single fathers in the United States with a correlation coefficient (R) of 0.720 and weighted average of 16.5%. Similarly, the statistical analysis conducted on geographies consisting of 247,264,844 people shows no correlation between the proportion of Armenians and poverty level among single fathers in the United States with a correlation coefficient (R) of -0.045 and weighted average of 15.4%, a difference of 7.4%.
Single Father Poverty Correlation Summary
| Measurement | Immigrants from Canada | Armenian |
| Minimum | 8.4% | 1.9% |
| Maximum | 100.0% | 37.4% |
| Range | 91.6% | 35.5% |
| Mean | 37.9% | 16.5% |
| Median | 28.5% | 15.1% |
| Interquartile 25% (IQ1) | 17.1% | 8.7% |
| Interquartile 75% (IQ3) | 57.0% | 21.4% |
| Interquartile Range (IQR) | 39.9% | 12.8% |
| Standard Deviation (Sample) | 28.1% | 9.3% |
| Standard Deviation (Population) | 27.3% | 9.2% |
Similar Demographics by Single Father Poverty
Demographics Similar to Immigrants from Canada by Single Father Poverty
In terms of single father poverty, the demographic groups most similar to Immigrants from Canada are Immigrants from Northern Europe (16.5%, a difference of 0.11%), Romanian (16.5%, a difference of 0.12%), Immigrants from Belize (16.5%, a difference of 0.14%), Cape Verdean (16.5%, a difference of 0.15%), and Immigrants from Barbados (16.5%, a difference of 0.15%).
| Demographics | Rating | Rank | Single Father Poverty |
| Latvians | 28.9 /100 | #189 | Fair 16.5% |
| Immigrants | Burma/Myanmar | 28.0 /100 | #190 | Fair 16.5% |
| Immigrants | Guyana | 27.1 /100 | #191 | Fair 16.5% |
| Immigrants | Switzerland | 24.8 /100 | #192 | Fair 16.5% |
| Ecuadorians | 24.5 /100 | #193 | Fair 16.5% |
| Cape Verdeans | 24.4 /100 | #194 | Fair 16.5% |
| Immigrants | Barbados | 24.3 /100 | #195 | Fair 16.5% |
| Immigrants | Canada | 21.9 /100 | #196 | Fair 16.5% |
| Immigrants | Northern Europe | 20.3 /100 | #197 | Fair 16.5% |
| Romanians | 20.1 /100 | #198 | Fair 16.5% |
| Immigrants | Belize | 19.8 /100 | #199 | Poor 16.5% |
| Syrians | 17.4 /100 | #200 | Poor 16.6% |
| Cubans | 16.5 /100 | #201 | Poor 16.6% |
| Immigrants | Croatia | 16.5 /100 | #202 | Poor 16.6% |
| Immigrants | North America | 15.1 /100 | #203 | Poor 16.6% |
Demographics Similar to Armenians by Single Father Poverty
In terms of single father poverty, the demographic groups most similar to Armenians are Immigrants from Congo (15.4%, a difference of 0.020%), Immigrants from Ukraine (15.4%, a difference of 0.030%), Chinese (15.4%, a difference of 0.12%), Immigrants from Northern Africa (15.3%, a difference of 0.23%), and Tlingit-Haida (15.3%, a difference of 0.25%).
| Demographics | Rating | Rank | Single Father Poverty |
| Kenyans | 99.6 /100 | #73 | Exceptional 15.3% |
| Maltese | 99.6 /100 | #74 | Exceptional 15.3% |
| Immigrants | Turkey | 99.5 /100 | #75 | Exceptional 15.3% |
| Immigrants | Japan | 99.5 /100 | #76 | Exceptional 15.3% |
| Immigrants | Peru | 99.5 /100 | #77 | Exceptional 15.3% |
| Tlingit-Haida | 99.5 /100 | #78 | Exceptional 15.3% |
| Immigrants | Northern Africa | 99.5 /100 | #79 | Exceptional 15.3% |
| Armenians | 99.4 /100 | #80 | Exceptional 15.4% |
| Immigrants | Congo | 99.4 /100 | #81 | Exceptional 15.4% |
| Immigrants | Ukraine | 99.4 /100 | #82 | Exceptional 15.4% |
| Chinese | 99.3 /100 | #83 | Exceptional 15.4% |
| Peruvians | 99.2 /100 | #84 | Exceptional 15.4% |
| Immigrants | Oceania | 99.1 /100 | #85 | Exceptional 15.4% |
| Immigrants | Russia | 99.0 /100 | #86 | Exceptional 15.5% |
| Brazilians | 99.0 /100 | #87 | Exceptional 15.5% |