Immigrants from Cameroon vs Trinidadian and Tobagonian Child Poverty Under the Age of 16
COMPARE
Immigrants from Cameroon
Trinidadian and Tobagonian
Child Poverty Under the Age of 16
Child Poverty Under the Age of 16 Comparison
Immigrants from Cameroon
Trinidadians and Tobagonians
17.1%
CHILD POVERTY UNDER THE AGE OF 16
14.7/ 100
METRIC RATING
200th/ 347
METRIC RANK
19.2%
CHILD POVERTY UNDER THE AGE OF 16
0.2/ 100
METRIC RATING
255th/ 347
METRIC RANK
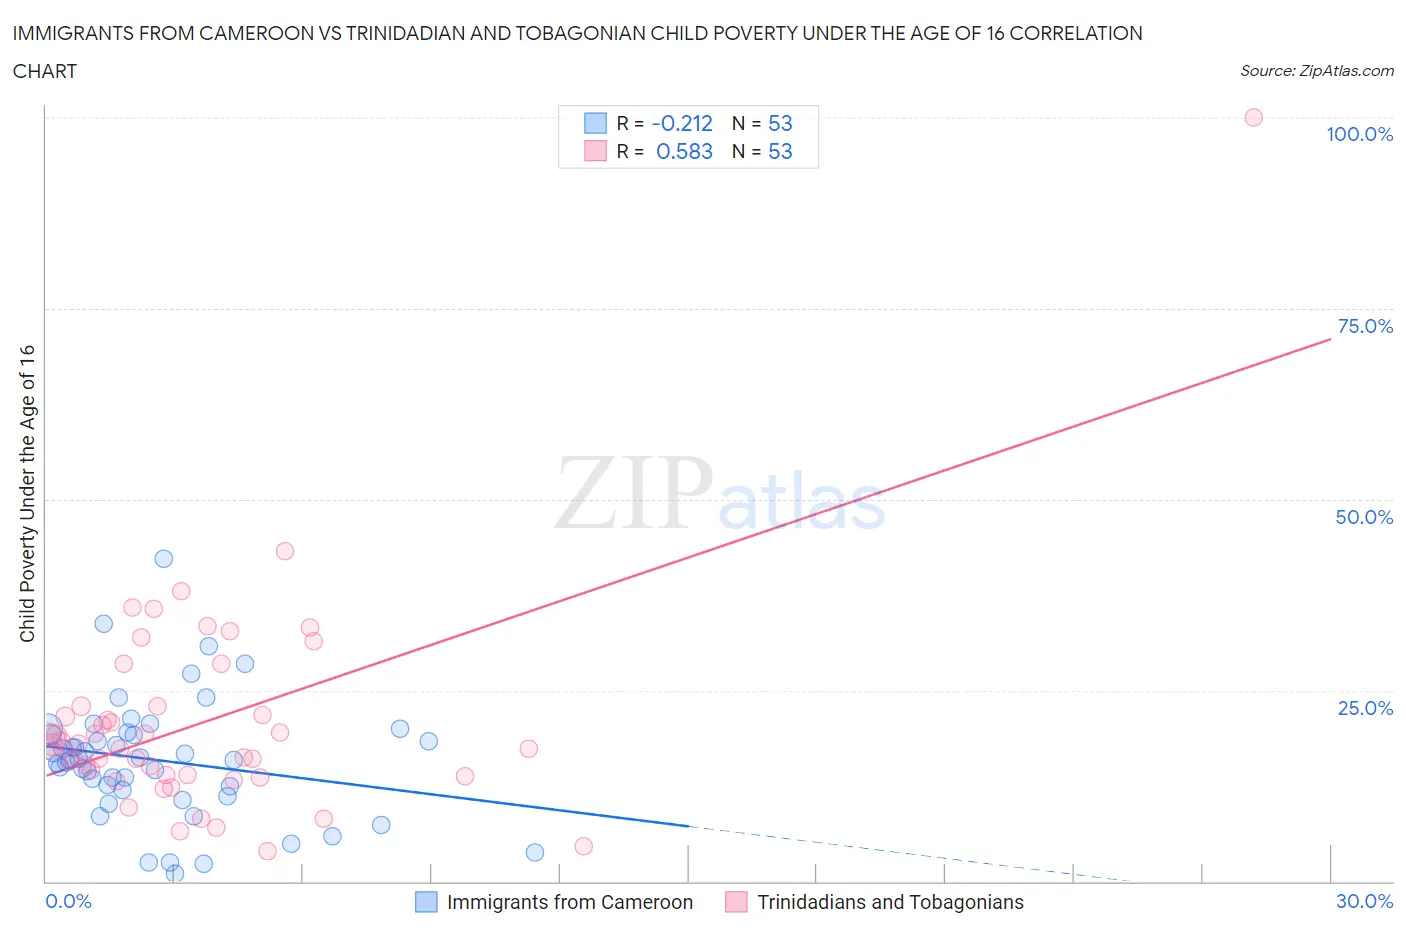
Immigrants from Cameroon vs Trinidadian and Tobagonian Child Poverty Under the Age of 16 Correlation Chart
The statistical analysis conducted on geographies consisting of 130,547,107 people shows a weak negative correlation between the proportion of Immigrants from Cameroon and poverty level among children under the age of 16 in the United States with a correlation coefficient (R) of -0.212 and weighted average of 17.1%. Similarly, the statistical analysis conducted on geographies consisting of 218,888,233 people shows a substantial positive correlation between the proportion of Trinidadians and Tobagonians and poverty level among children under the age of 16 in the United States with a correlation coefficient (R) of 0.583 and weighted average of 19.2%, a difference of 12.5%.
Child Poverty Under the Age of 16 Correlation Summary
| Measurement | Immigrants from Cameroon | Trinidadian and Tobagonian |
| Minimum | 0.90% | 4.0% |
| Maximum | 42.2% | 100.0% |
| Range | 41.3% | 96.0% |
| Mean | 15.8% | 20.8% |
| Median | 15.9% | 17.9% |
| Interquartile 25% (IQ1) | 11.5% | 13.8% |
| Interquartile 75% (IQ3) | 19.4% | 22.9% |
| Interquartile Range (IQR) | 7.8% | 9.1% |
| Standard Deviation (Sample) | 8.0% | 14.2% |
| Standard Deviation (Population) | 7.9% | 14.1% |
Similar Demographics by Child Poverty Under the Age of 16
Demographics Similar to Immigrants from Cameroon by Child Poverty Under the Age of 16
In terms of child poverty under the age of 16, the demographic groups most similar to Immigrants from Cameroon are Immigrants from Uzbekistan (17.1%, a difference of 0.010%), Ugandan (17.1%, a difference of 0.090%), Immigrants from Afghanistan (17.0%, a difference of 0.10%), Immigrants from Sierra Leone (17.1%, a difference of 0.11%), and Hmong (17.1%, a difference of 0.17%).
| Demographics | Rating | Rank | Child Poverty Under the Age of 16 |
| Spaniards | 23.2 /100 | #193 | Fair 16.8% |
| Immigrants | Uruguay | 23.1 /100 | #194 | Fair 16.8% |
| Immigrants | Uganda | 22.5 /100 | #195 | Fair 16.8% |
| Immigrants | Lebanon | 22.0 /100 | #196 | Fair 16.8% |
| Immigrants | Kenya | 19.1 /100 | #197 | Poor 16.9% |
| Delaware | 17.1 /100 | #198 | Poor 17.0% |
| Immigrants | Afghanistan | 15.1 /100 | #199 | Poor 17.0% |
| Immigrants | Cameroon | 14.7 /100 | #200 | Poor 17.1% |
| Immigrants | Uzbekistan | 14.7 /100 | #201 | Poor 17.1% |
| Ugandans | 14.3 /100 | #202 | Poor 17.1% |
| Immigrants | Sierra Leone | 14.2 /100 | #203 | Poor 17.1% |
| Hmong | 14.0 /100 | #204 | Poor 17.1% |
| Aleuts | 13.9 /100 | #205 | Poor 17.1% |
| Alaska Natives | 11.8 /100 | #206 | Poor 17.2% |
| German Russians | 8.6 /100 | #207 | Tragic 17.4% |
Demographics Similar to Trinidadians and Tobagonians by Child Poverty Under the Age of 16
In terms of child poverty under the age of 16, the demographic groups most similar to Trinidadians and Tobagonians are Inupiat (19.2%, a difference of 0.090%), Ottawa (19.2%, a difference of 0.10%), Immigrants from Western Africa (19.2%, a difference of 0.17%), Spanish American (19.2%, a difference of 0.18%), and Salvadoran (19.1%, a difference of 0.42%).
| Demographics | Rating | Rank | Child Poverty Under the Age of 16 |
| Ecuadorians | 0.3 /100 | #248 | Tragic 19.0% |
| Potawatomi | 0.3 /100 | #249 | Tragic 19.0% |
| Immigrants | Middle Africa | 0.3 /100 | #250 | Tragic 19.0% |
| Immigrants | Ghana | 0.3 /100 | #251 | Tragic 19.1% |
| Immigrants | Trinidad and Tobago | 0.3 /100 | #252 | Tragic 19.1% |
| Salvadorans | 0.3 /100 | #253 | Tragic 19.1% |
| Immigrants | Western Africa | 0.2 /100 | #254 | Tragic 19.2% |
| Trinidadians and Tobagonians | 0.2 /100 | #255 | Tragic 19.2% |
| Inupiat | 0.2 /100 | #256 | Tragic 19.2% |
| Ottawa | 0.2 /100 | #257 | Tragic 19.2% |
| Spanish Americans | 0.2 /100 | #258 | Tragic 19.2% |
| Mexican American Indians | 0.2 /100 | #259 | Tragic 19.3% |
| Guyanese | 0.2 /100 | #260 | Tragic 19.3% |
| Immigrants | Burma/Myanmar | 0.1 /100 | #261 | Tragic 19.4% |
| Immigrants | Guyana | 0.1 /100 | #262 | Tragic 19.4% |