Immigrants from Cambodia vs Cree Child Poverty Among Girls Under 16
COMPARE
Immigrants from Cambodia
Cree
Child Poverty Among Girls Under 16
Child Poverty Among Girls Under 16 Comparison
Immigrants from Cambodia
Cree
18.1%
CHILD POVERTY AMONG GIRLS UNDER 16
2.9/ 100
METRIC RATING
222nd/ 347
METRIC RANK
18.5%
CHILD POVERTY AMONG GIRLS UNDER 16
1.3/ 100
METRIC RATING
231st/ 347
METRIC RANK
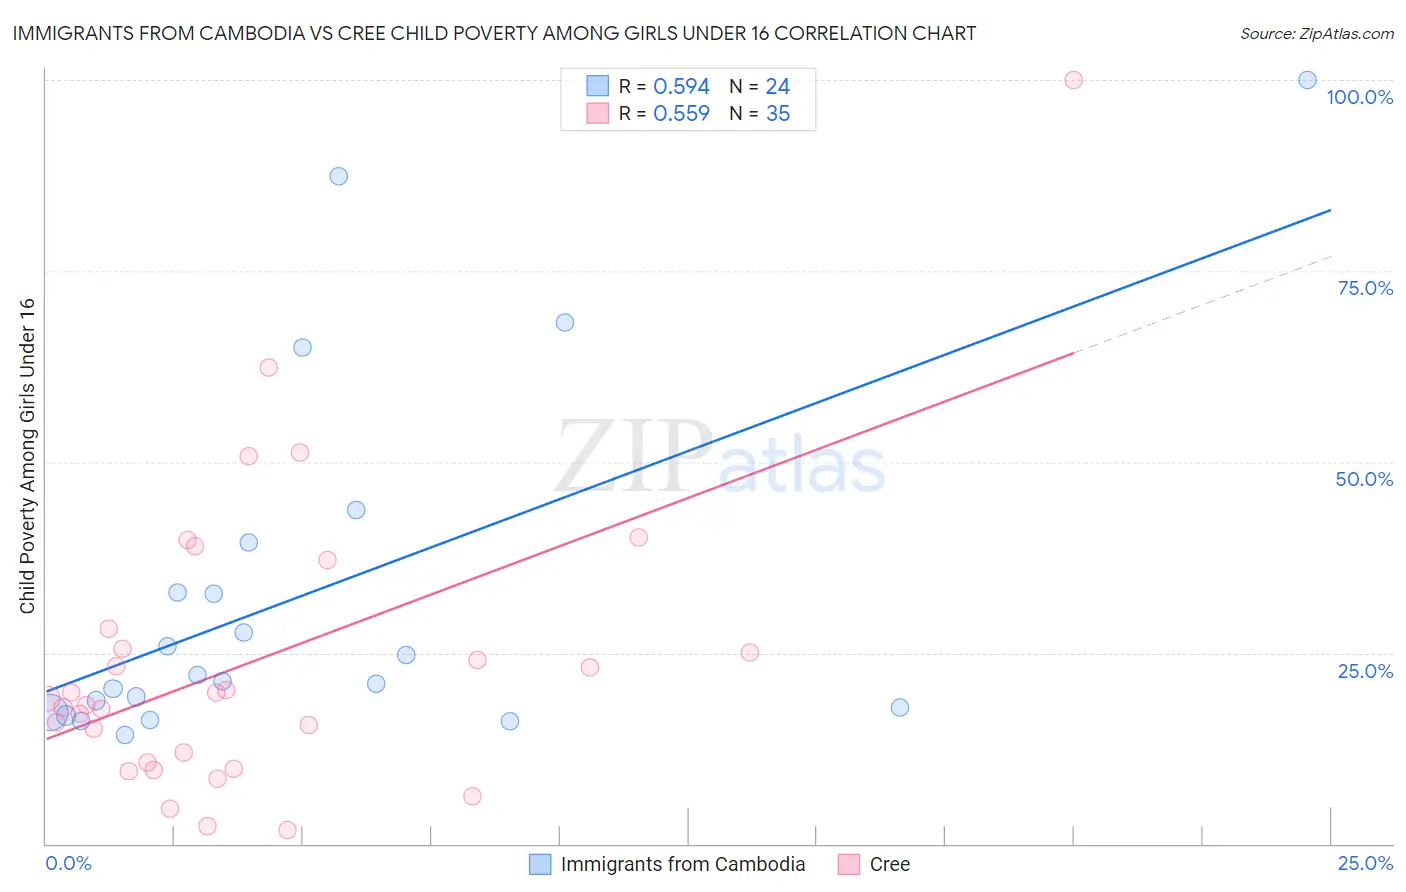
Immigrants from Cambodia vs Cree Child Poverty Among Girls Under 16 Correlation Chart
The statistical analysis conducted on geographies consisting of 204,042,546 people shows a substantial positive correlation between the proportion of Immigrants from Cambodia and poverty level among girls under the age of 16 in the United States with a correlation coefficient (R) of 0.594 and weighted average of 18.1%. Similarly, the statistical analysis conducted on geographies consisting of 75,883,921 people shows a substantial positive correlation between the proportion of Cree and poverty level among girls under the age of 16 in the United States with a correlation coefficient (R) of 0.559 and weighted average of 18.5%, a difference of 2.2%.
Child Poverty Among Girls Under 16 Correlation Summary
| Measurement | Immigrants from Cambodia | Cree |
| Minimum | 14.3% | 1.8% |
| Maximum | 100.0% | 100.0% |
| Range | 85.7% | 98.2% |
| Mean | 32.7% | 24.0% |
| Median | 21.7% | 19.0% |
| Interquartile 25% (IQ1) | 17.4% | 10.7% |
| Interquartile 75% (IQ3) | 36.1% | 28.2% |
| Interquartile Range (IQR) | 18.7% | 17.5% |
| Standard Deviation (Sample) | 23.7% | 19.5% |
| Standard Deviation (Population) | 23.2% | 19.2% |
Demographics Similar to Immigrants from Cambodia and Cree by Child Poverty Among Girls Under 16
In terms of child poverty among girls under 16, the demographic groups most similar to Immigrants from Cambodia are Immigrants from Armenia (18.1%, a difference of 0.0%), Bermudan (18.1%, a difference of 0.080%), Immigrants from Africa (18.2%, a difference of 0.17%), Nicaraguan (18.2%, a difference of 0.50%), and Immigrants from Micronesia (18.0%, a difference of 0.52%). Similarly, the demographic groups most similar to Cree are Osage (18.5%, a difference of 0.080%), Immigrants from Sudan (18.6%, a difference of 0.24%), Ghanaian (18.5%, a difference of 0.27%), Sudanese (18.6%, a difference of 0.28%), and Fijian (18.6%, a difference of 0.35%).
| Demographics | Rating | Rank | Child Poverty Among Girls Under 16 |
| Moroccans | 5.5 /100 | #216 | Tragic 17.8% |
| Japanese | 5.3 /100 | #217 | Tragic 17.8% |
| Alaska Natives | 5.2 /100 | #218 | Tragic 17.8% |
| Immigrants | Panama | 4.7 /100 | #219 | Tragic 17.9% |
| Cubans | 4.1 /100 | #220 | Tragic 18.0% |
| Immigrants | Micronesia | 3.5 /100 | #221 | Tragic 18.0% |
| Immigrants | Cambodia | 2.9 /100 | #222 | Tragic 18.1% |
| Immigrants | Armenia | 2.9 /100 | #223 | Tragic 18.1% |
| Bermudans | 2.8 /100 | #224 | Tragic 18.1% |
| Immigrants | Africa | 2.7 /100 | #225 | Tragic 18.2% |
| Nicaraguans | 2.4 /100 | #226 | Tragic 18.2% |
| Immigrants | Nonimmigrants | 2.0 /100 | #227 | Tragic 18.3% |
| Alaskan Athabascans | 2.0 /100 | #228 | Tragic 18.3% |
| Ghanaians | 1.4 /100 | #229 | Tragic 18.5% |
| Osage | 1.3 /100 | #230 | Tragic 18.5% |
| Cree | 1.3 /100 | #231 | Tragic 18.5% |
| Immigrants | Sudan | 1.1 /100 | #232 | Tragic 18.6% |
| Sudanese | 1.1 /100 | #233 | Tragic 18.6% |
| Fijians | 1.1 /100 | #234 | Tragic 18.6% |
| Nepalese | 1.1 /100 | #235 | Tragic 18.6% |
| Alsatians | 1.1 /100 | #236 | Tragic 18.6% |