Immigrants from Bulgaria vs Haitian Child Poverty Under the Age of 5
COMPARE
Immigrants from Bulgaria
Haitian
Child Poverty Under the Age of 5
Child Poverty Under the Age of 5 Comparison
Immigrants from Bulgaria
Haitians
14.8%
CHILD POVERTY UNDER THE AGE OF 5
99.6/ 100
METRIC RATING
49th/ 347
METRIC RANK
21.2%
CHILD POVERTY UNDER THE AGE OF 5
0.0/ 100
METRIC RATING
285th/ 347
METRIC RANK
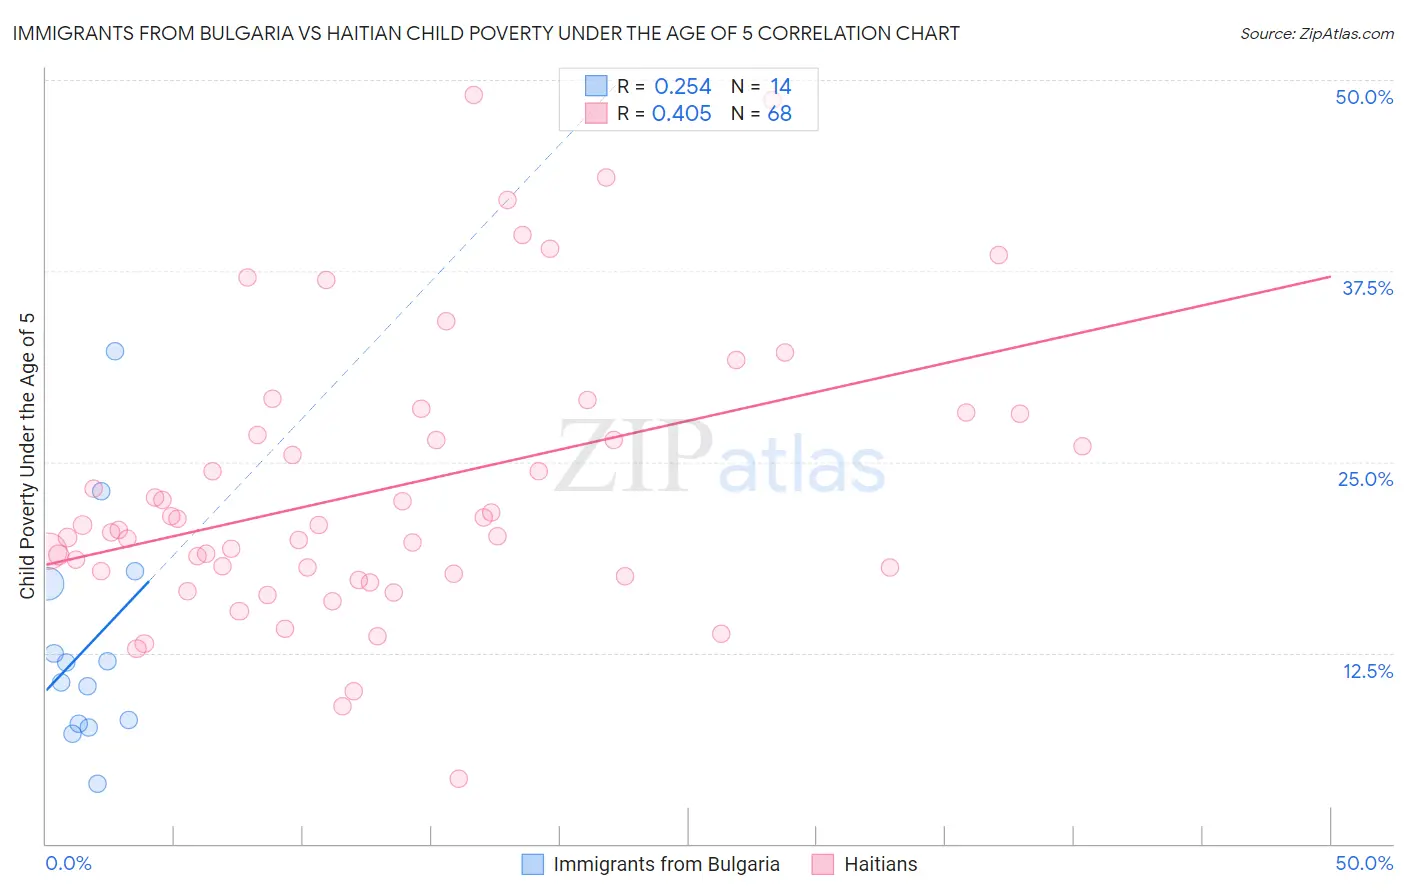
Immigrants from Bulgaria vs Haitian Child Poverty Under the Age of 5 Correlation Chart
The statistical analysis conducted on geographies consisting of 167,925,636 people shows a weak positive correlation between the proportion of Immigrants from Bulgaria and poverty level among children under the age of 5 in the United States with a correlation coefficient (R) of 0.254 and weighted average of 14.8%. Similarly, the statistical analysis conducted on geographies consisting of 279,774,942 people shows a moderate positive correlation between the proportion of Haitians and poverty level among children under the age of 5 in the United States with a correlation coefficient (R) of 0.405 and weighted average of 21.2%, a difference of 43.4%.
Child Poverty Under the Age of 5 Correlation Summary
| Measurement | Immigrants from Bulgaria | Haitian |
| Minimum | 4.0% | 4.2% |
| Maximum | 32.2% | 49.0% |
| Range | 28.3% | 44.7% |
| Mean | 13.0% | 23.3% |
| Median | 11.2% | 20.7% |
| Interquartile 25% (IQ1) | 7.9% | 17.8% |
| Interquartile 75% (IQ3) | 17.0% | 27.5% |
| Interquartile Range (IQR) | 9.1% | 9.7% |
| Standard Deviation (Sample) | 7.4% | 9.1% |
| Standard Deviation (Population) | 7.2% | 9.1% |
Similar Demographics by Child Poverty Under the Age of 5
Demographics Similar to Immigrants from Bulgaria by Child Poverty Under the Age of 5
In terms of child poverty under the age of 5, the demographic groups most similar to Immigrants from Bulgaria are Immigrants from Northern Europe (14.8%, a difference of 0.090%), Estonian (14.8%, a difference of 0.14%), Immigrants from Czechoslovakia (14.8%, a difference of 0.15%), Russian (14.8%, a difference of 0.26%), and Tsimshian (14.7%, a difference of 0.39%).
| Demographics | Rating | Rank | Child Poverty Under the Age of 5 |
| Soviet Union | 99.7 /100 | #42 | Exceptional 14.7% |
| Immigrants | Greece | 99.7 /100 | #43 | Exceptional 14.7% |
| Immigrants | Philippines | 99.7 /100 | #44 | Exceptional 14.7% |
| Laotians | 99.6 /100 | #45 | Exceptional 14.7% |
| Tsimshian | 99.6 /100 | #46 | Exceptional 14.7% |
| Russians | 99.6 /100 | #47 | Exceptional 14.8% |
| Immigrants | Czechoslovakia | 99.6 /100 | #48 | Exceptional 14.8% |
| Immigrants | Bulgaria | 99.6 /100 | #49 | Exceptional 14.8% |
| Immigrants | Northern Europe | 99.6 /100 | #50 | Exceptional 14.8% |
| Estonians | 99.6 /100 | #51 | Exceptional 14.8% |
| Immigrants | Serbia | 99.5 /100 | #52 | Exceptional 14.9% |
| Luxembourgers | 99.4 /100 | #53 | Exceptional 14.9% |
| Immigrants | Israel | 99.4 /100 | #54 | Exceptional 14.9% |
| Danes | 99.4 /100 | #55 | Exceptional 14.9% |
| Immigrants | Pakistan | 99.4 /100 | #56 | Exceptional 14.9% |
Demographics Similar to Haitians by Child Poverty Under the Age of 5
In terms of child poverty under the age of 5, the demographic groups most similar to Haitians are Immigrants from Latin America (21.2%, a difference of 0.080%), Immigrants from Zaire (21.3%, a difference of 0.17%), Immigrants from Senegal (21.3%, a difference of 0.34%), Immigrants from Haiti (21.3%, a difference of 0.41%), and Somali (21.1%, a difference of 0.47%).
| Demographics | Rating | Rank | Child Poverty Under the Age of 5 |
| Immigrants | Grenada | 0.0 /100 | #278 | Tragic 20.7% |
| Sub-Saharan Africans | 0.0 /100 | #279 | Tragic 20.8% |
| French American Indians | 0.0 /100 | #280 | Tragic 20.8% |
| Senegalese | 0.0 /100 | #281 | Tragic 20.9% |
| Potawatomi | 0.0 /100 | #282 | Tragic 21.0% |
| Comanche | 0.0 /100 | #283 | Tragic 21.0% |
| Somalis | 0.0 /100 | #284 | Tragic 21.1% |
| Haitians | 0.0 /100 | #285 | Tragic 21.2% |
| Immigrants | Latin America | 0.0 /100 | #286 | Tragic 21.2% |
| Immigrants | Zaire | 0.0 /100 | #287 | Tragic 21.3% |
| Immigrants | Senegal | 0.0 /100 | #288 | Tragic 21.3% |
| Immigrants | Haiti | 0.0 /100 | #289 | Tragic 21.3% |
| Immigrants | Caribbean | 0.0 /100 | #290 | Tragic 21.4% |
| British West Indians | 0.0 /100 | #291 | Tragic 21.4% |
| Immigrants | Somalia | 0.0 /100 | #292 | Tragic 21.6% |