Immigrants from Bosnia and Herzegovina vs Immigrants from Nepal Seniors Poverty Over the Age of 75
COMPARE
Immigrants from Bosnia and Herzegovina
Immigrants from Nepal
Seniors Poverty Over the Age of 75
Seniors Poverty Over the Age of 75 Comparison
Immigrants from Bosnia and Herzegovina
Immigrants from Nepal
11.6%
SENIORS POVERTY OVER THE AGE OF 75
92.6/ 100
METRIC RATING
95th/ 347
METRIC RANK
11.8%
SENIORS POVERTY OVER THE AGE OF 75
84.5/ 100
METRIC RATING
120th/ 347
METRIC RANK
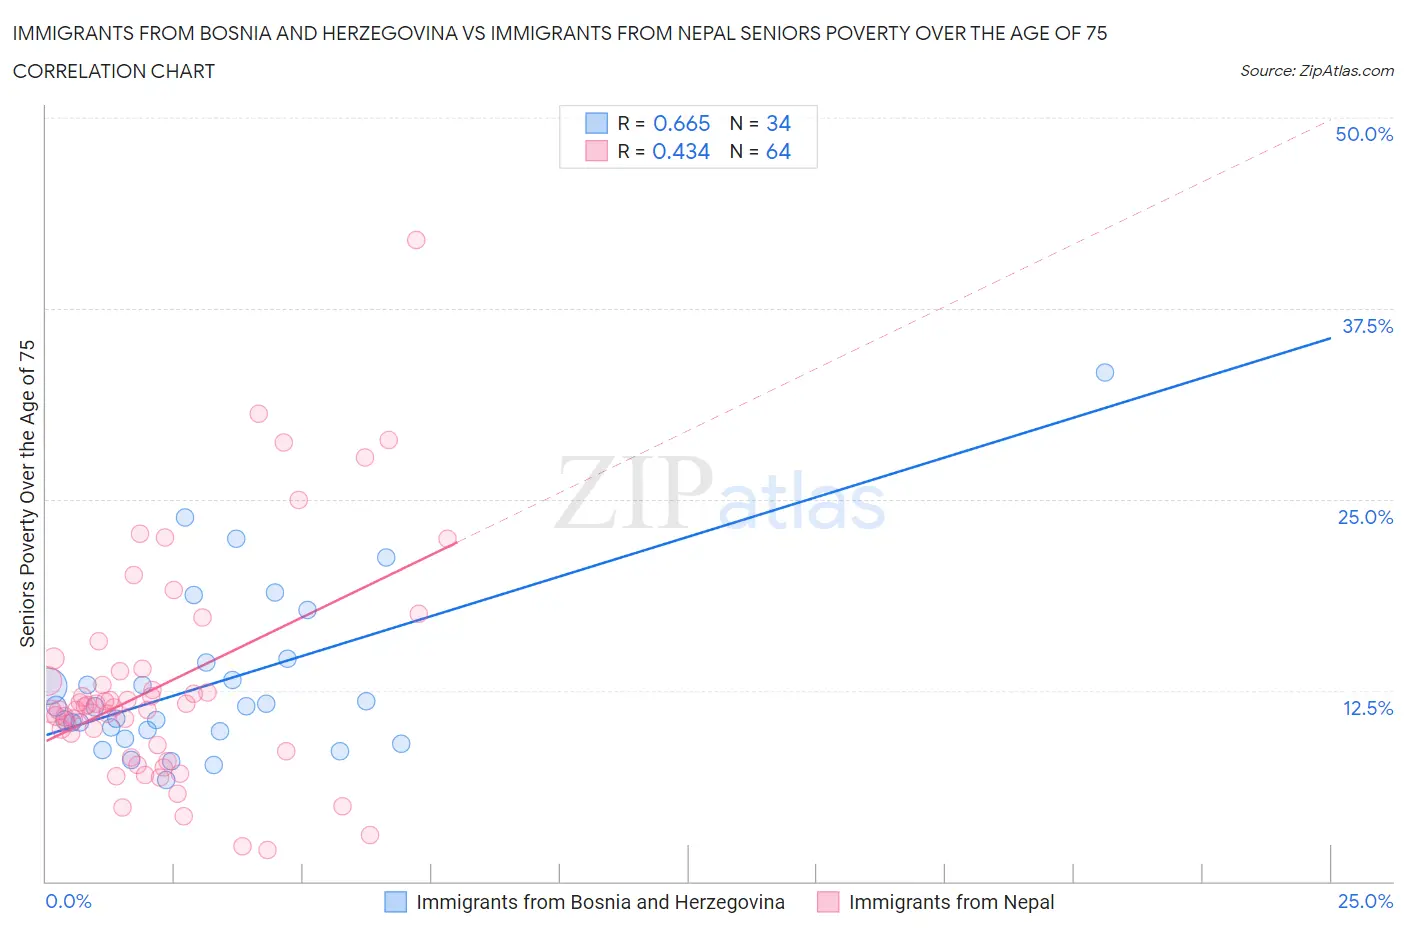
Immigrants from Bosnia and Herzegovina vs Immigrants from Nepal Seniors Poverty Over the Age of 75 Correlation Chart
The statistical analysis conducted on geographies consisting of 156,215,994 people shows a significant positive correlation between the proportion of Immigrants from Bosnia and Herzegovina and poverty level among seniors over the age of 75 in the United States with a correlation coefficient (R) of 0.665 and weighted average of 11.6%. Similarly, the statistical analysis conducted on geographies consisting of 185,282,037 people shows a moderate positive correlation between the proportion of Immigrants from Nepal and poverty level among seniors over the age of 75 in the United States with a correlation coefficient (R) of 0.434 and weighted average of 11.8%, a difference of 1.8%.
Seniors Poverty Over the Age of 75 Correlation Summary
| Measurement | Immigrants from Bosnia and Herzegovina | Immigrants from Nepal |
| Minimum | 6.6% | 2.1% |
| Maximum | 33.3% | 42.0% |
| Range | 26.7% | 39.9% |
| Mean | 13.0% | 12.9% |
| Median | 11.4% | 11.4% |
| Interquartile 25% (IQ1) | 9.8% | 8.7% |
| Interquartile 75% (IQ3) | 14.3% | 13.8% |
| Interquartile Range (IQR) | 4.5% | 5.1% |
| Standard Deviation (Sample) | 5.6% | 7.4% |
| Standard Deviation (Population) | 5.5% | 7.3% |
Similar Demographics by Seniors Poverty Over the Age of 75
Demographics Similar to Immigrants from Bosnia and Herzegovina by Seniors Poverty Over the Age of 75
In terms of seniors poverty over the age of 75, the demographic groups most similar to Immigrants from Bosnia and Herzegovina are Immigrants from Sweden (11.6%, a difference of 0.0%), Creek (11.6%, a difference of 0.040%), Romanian (11.6%, a difference of 0.080%), Immigrants from Poland (11.6%, a difference of 0.090%), and Immigrants from Japan (11.6%, a difference of 0.20%).
| Demographics | Rating | Rank | Seniors Poverty Over the Age of 75 |
| Immigrants | Croatia | 94.5 /100 | #88 | Exceptional 11.5% |
| Immigrants | Sri Lanka | 94.4 /100 | #89 | Exceptional 11.5% |
| Aleuts | 94.1 /100 | #90 | Exceptional 11.5% |
| Immigrants | Germany | 94.1 /100 | #91 | Exceptional 11.5% |
| Kenyans | 93.9 /100 | #92 | Exceptional 11.5% |
| Immigrants | Poland | 92.9 /100 | #93 | Exceptional 11.6% |
| Creek | 92.7 /100 | #94 | Exceptional 11.6% |
| Immigrants | Bosnia and Herzegovina | 92.6 /100 | #95 | Exceptional 11.6% |
| Immigrants | Sweden | 92.6 /100 | #96 | Exceptional 11.6% |
| Romanians | 92.3 /100 | #97 | Exceptional 11.6% |
| Immigrants | Japan | 91.9 /100 | #98 | Exceptional 11.6% |
| Immigrants | Ethiopia | 91.7 /100 | #99 | Exceptional 11.6% |
| Syrians | 91.1 /100 | #100 | Exceptional 11.6% |
| Jordanians | 90.8 /100 | #101 | Exceptional 11.6% |
| Guamanians/Chamorros | 90.6 /100 | #102 | Exceptional 11.6% |
Demographics Similar to Immigrants from Nepal by Seniors Poverty Over the Age of 75
In terms of seniors poverty over the age of 75, the demographic groups most similar to Immigrants from Nepal are Immigrants from Uganda (11.8%, a difference of 0.040%), Malaysian (11.8%, a difference of 0.080%), Pakistani (11.8%, a difference of 0.080%), Immigrants from Italy (11.8%, a difference of 0.090%), and Fijian (11.8%, a difference of 0.12%).
| Demographics | Rating | Rank | Seniors Poverty Over the Age of 75 |
| Immigrants | Czechoslovakia | 87.0 /100 | #113 | Excellent 11.7% |
| Ukrainians | 86.9 /100 | #114 | Excellent 11.7% |
| New Zealanders | 86.3 /100 | #115 | Excellent 11.7% |
| Iraqis | 86.3 /100 | #116 | Excellent 11.7% |
| Icelanders | 85.7 /100 | #117 | Excellent 11.7% |
| Immigrants | Zimbabwe | 85.5 /100 | #118 | Excellent 11.7% |
| Immigrants | Uganda | 84.8 /100 | #119 | Excellent 11.8% |
| Immigrants | Nepal | 84.5 /100 | #120 | Excellent 11.8% |
| Malaysians | 84.1 /100 | #121 | Excellent 11.8% |
| Pakistanis | 84.0 /100 | #122 | Excellent 11.8% |
| Immigrants | Italy | 84.0 /100 | #123 | Excellent 11.8% |
| Fijians | 83.8 /100 | #124 | Excellent 11.8% |
| Sudanese | 83.6 /100 | #125 | Excellent 11.8% |
| Pennsylvania Germans | 83.4 /100 | #126 | Excellent 11.8% |
| Immigrants | Denmark | 82.6 /100 | #127 | Excellent 11.8% |