Immigrants from Bolivia vs Immigrants from Indonesia Child Poverty Among Girls Under 16
COMPARE
Immigrants from Bolivia
Immigrants from Indonesia
Child Poverty Among Girls Under 16
Child Poverty Among Girls Under 16 Comparison
Immigrants from Bolivia
Immigrants from Indonesia
14.0%
CHILD POVERTY AMONG GIRLS UNDER 16
99.5/ 100
METRIC RATING
41st/ 347
METRIC RANK
14.4%
CHILD POVERTY AMONG GIRLS UNDER 16
98.9/ 100
METRIC RATING
56th/ 347
METRIC RANK
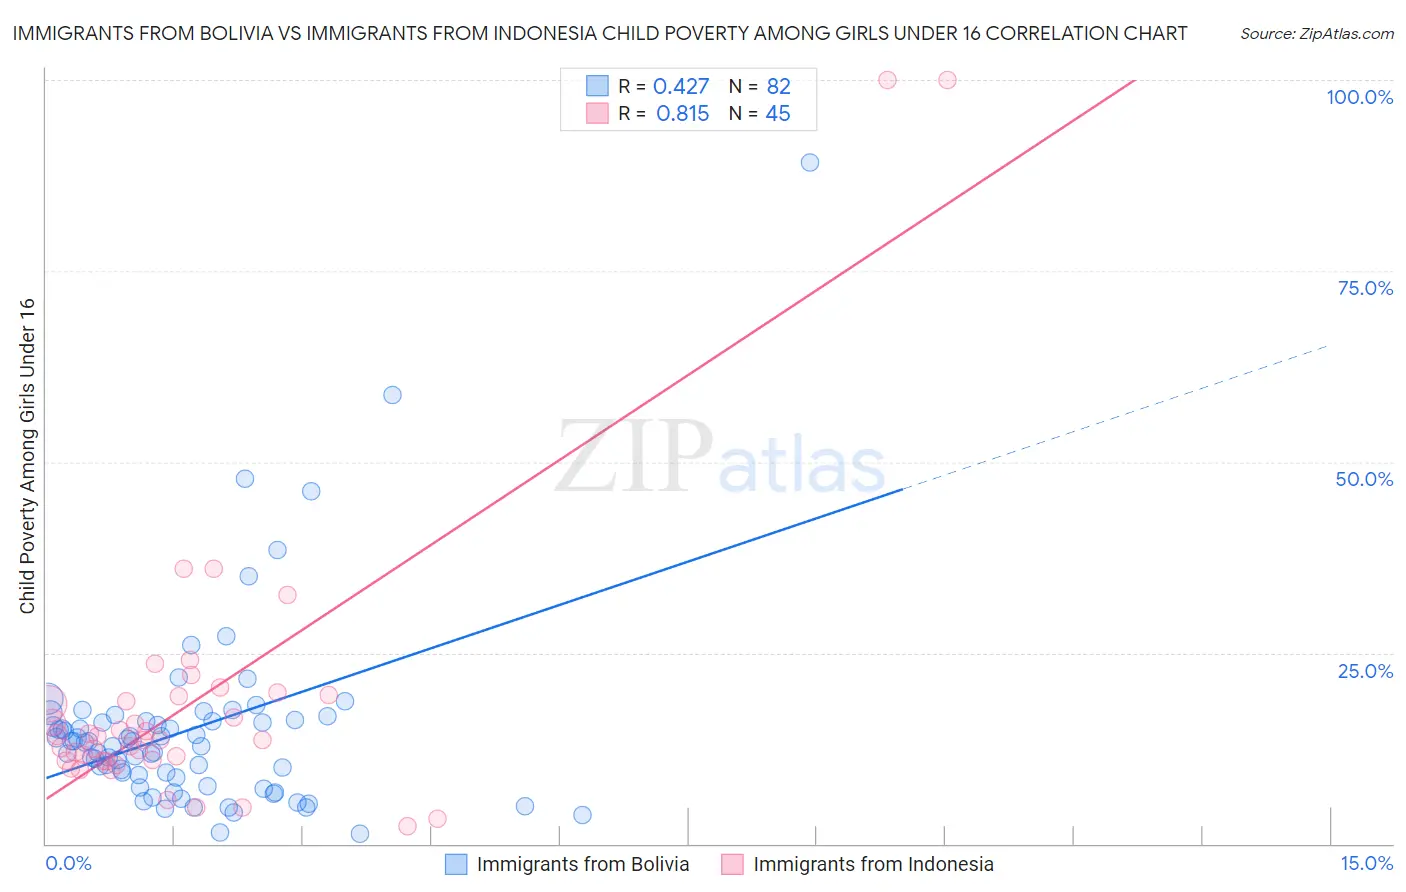
Immigrants from Bolivia vs Immigrants from Indonesia Child Poverty Among Girls Under 16 Correlation Chart
The statistical analysis conducted on geographies consisting of 157,706,264 people shows a moderate positive correlation between the proportion of Immigrants from Bolivia and poverty level among girls under the age of 16 in the United States with a correlation coefficient (R) of 0.427 and weighted average of 14.0%. Similarly, the statistical analysis conducted on geographies consisting of 213,789,101 people shows a very strong positive correlation between the proportion of Immigrants from Indonesia and poverty level among girls under the age of 16 in the United States with a correlation coefficient (R) of 0.815 and weighted average of 14.4%, a difference of 2.5%.
Child Poverty Among Girls Under 16 Correlation Summary
| Measurement | Immigrants from Bolivia | Immigrants from Indonesia |
| Minimum | 1.4% | 2.3% |
| Maximum | 89.1% | 100.0% |
| Range | 87.8% | 97.7% |
| Mean | 15.0% | 18.7% |
| Median | 13.4% | 13.7% |
| Interquartile 25% (IQ1) | 8.7% | 10.9% |
| Interquartile 75% (IQ3) | 16.0% | 19.4% |
| Interquartile Range (IQR) | 7.3% | 8.5% |
| Standard Deviation (Sample) | 12.8% | 19.2% |
| Standard Deviation (Population) | 12.7% | 19.0% |
Demographics Similar to Immigrants from Bolivia and Immigrants from Indonesia by Child Poverty Among Girls Under 16
In terms of child poverty among girls under 16, the demographic groups most similar to Immigrants from Bolivia are Immigrants from Sri Lanka (14.0%, a difference of 0.0%), Immigrants from Australia (14.0%, a difference of 0.090%), Immigrants from Scotland (14.0%, a difference of 0.16%), Korean (14.1%, a difference of 0.31%), and Immigrants from Asia (14.1%, a difference of 0.45%). Similarly, the demographic groups most similar to Immigrants from Indonesia are Immigrants from Serbia (14.4%, a difference of 0.050%), Immigrants from Romania (14.3%, a difference of 0.080%), Estonian (14.3%, a difference of 0.12%), Immigrants from Bulgaria (14.4%, a difference of 0.13%), and Luxembourger (14.3%, a difference of 0.54%).
| Demographics | Rating | Rank | Child Poverty Among Girls Under 16 |
| Immigrants | Moldova | 99.6 /100 | #38 | Exceptional 13.9% |
| Immigrants | Australia | 99.5 /100 | #39 | Exceptional 14.0% |
| Immigrants | Sri Lanka | 99.5 /100 | #40 | Exceptional 14.0% |
| Immigrants | Bolivia | 99.5 /100 | #41 | Exceptional 14.0% |
| Immigrants | Scotland | 99.4 /100 | #42 | Exceptional 14.0% |
| Koreans | 99.4 /100 | #43 | Exceptional 14.1% |
| Immigrants | Asia | 99.4 /100 | #44 | Exceptional 14.1% |
| Immigrants | Greece | 99.3 /100 | #45 | Exceptional 14.1% |
| Croatians | 99.3 /100 | #46 | Exceptional 14.1% |
| Immigrants | Czechoslovakia | 99.3 /100 | #47 | Exceptional 14.2% |
| Czechs | 99.3 /100 | #48 | Exceptional 14.2% |
| Greeks | 99.2 /100 | #49 | Exceptional 14.2% |
| Immigrants | Israel | 99.2 /100 | #50 | Exceptional 14.2% |
| Immigrants | Pakistan | 99.1 /100 | #51 | Exceptional 14.2% |
| Italians | 99.1 /100 | #52 | Exceptional 14.3% |
| Luxembourgers | 99.0 /100 | #53 | Exceptional 14.3% |
| Estonians | 98.9 /100 | #54 | Exceptional 14.3% |
| Immigrants | Romania | 98.9 /100 | #55 | Exceptional 14.3% |
| Immigrants | Indonesia | 98.9 /100 | #56 | Exceptional 14.4% |
| Immigrants | Serbia | 98.9 /100 | #57 | Exceptional 14.4% |
| Immigrants | Bulgaria | 98.8 /100 | #58 | Exceptional 14.4% |